
|
Kilroy Realty Corporation (KRC) DCF Valuation |
Fully Editable: Tailor To Your Needs In Excel Or Sheets
Professional Design: Trusted, Industry-Standard Templates
Investor-Approved Valuation Models
MAC/PC Compatible, Fully Unlocked
No Expertise Is Needed; Easy To Follow
Kilroy Realty Corporation (KRC) Bundle
Simplify Kilroy Realty Corporation (KRC) valuation with this customizable DCF Calculator! Featuring real Kilroy Realty Corporation (KRC) financials and adjustable forecast inputs, you can test scenarios and uncover Kilroy Realty Corporation (KRC) fair value in minutes.
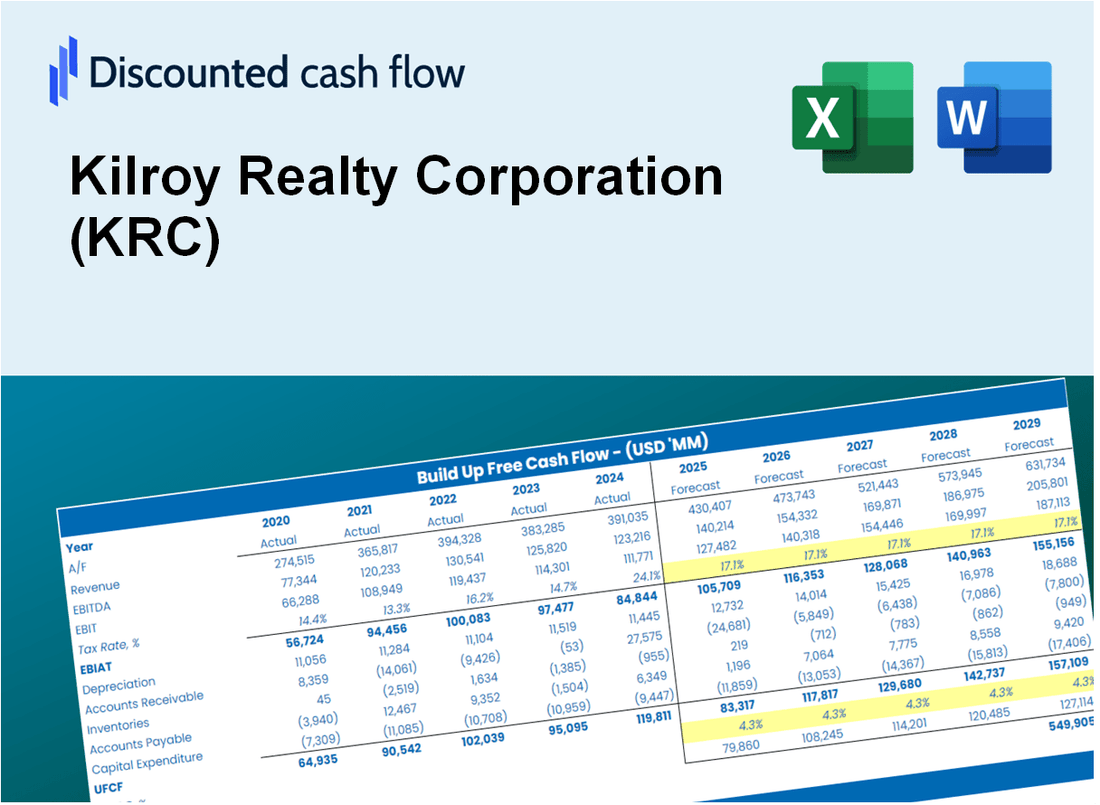
Discounted Cash Flow (DCF) - (USD MM)
| Year | AY1 2020 |
AY2 2021 |
AY3 2022 |
AY4 2023 |
AY5 2024 |
FY1 2025 |
FY2 2026 |
FY3 2027 |
FY4 2028 |
FY5 2029 |
|---|---|---|---|---|---|---|---|---|---|---|
| Revenue | 898.4 | 955.0 | 1,097.0 | 1,129.7 | 1,135.6 | 1,205.7 | 1,280.1 | 1,359.0 | 1,442.9 | 1,531.9 |
| Revenue Growth, % | 0 | 6.3 | 14.86 | 2.98 | 0.52536 | 6.17 | 6.17 | 6.17 | 6.17 | 6.17 |
| EBITDA | 538.4 | 553.3 | 659.8 | 708.8 | 735.5 | 736.7 | 782.2 | 830.4 | 881.7 | 936.1 |
| EBITDA, % | 59.93 | 57.94 | 60.15 | 62.74 | 64.76 | 61.11 | 61.11 | 61.11 | 61.11 | 61.11 |
| Depreciation | 300.1 | 672.4 | 316.1 | 356.3 | 357.2 | 471.7 | 500.8 | 531.7 | 564.5 | 599.3 |
| Depreciation, % | 33.41 | 70.4 | 28.81 | 31.54 | 31.46 | 39.12 | 39.12 | 39.12 | 39.12 | 39.12 |
| EBIT | 238.3 | -119.0 | 343.8 | 352.5 | 378.2 | 265.0 | 281.4 | 298.7 | 317.2 | 336.7 |
| EBIT, % | 26.52 | -12.46 | 31.34 | 31.2 | 33.31 | 21.98 | 21.98 | 21.98 | 21.98 | 21.98 |
| Total Cash | 759.5 | 441.6 | 347.4 | 510.2 | 193.7 | 541.7 | 575.1 | 610.6 | 648.3 | 688.3 |
| Total Cash, percent | .0 | .0 | .0 | .0 | .0 | .0 | .0 | .0 | .0 | .0 |
| Account Receivables | 398.7 | 420.1 | 472.8 | 474.6 | 463.0 | 516.6 | 548.5 | 582.3 | 618.2 | 656.4 |
| Account Receivables, % | 44.38 | 43.98 | 43.1 | 42.01 | 40.77 | 42.85 | 42.85 | 42.85 | 42.85 | 42.85 |
| Inventories | .0 | 10.3 | .0 | .0 | .0 | 2.6 | 2.8 | 2.9 | 3.1 | 3.3 |
| Inventories, % | 0 | 1.08 | 0 | 0 | 0 | 0.21651 | 0.21651 | 0.21651 | 0.21651 | 0.21651 |
| Accounts Payable | 445.1 | 316.1 | 311.9 | 371.2 | 285.0 | 407.6 | 432.7 | 459.4 | 487.7 | 517.8 |
| Accounts Payable, % | 49.54 | 33.09 | 28.43 | 32.86 | 25.1 | 33.8 | 33.8 | 33.8 | 33.8 | 33.8 |
| Capital Expenditure | -616.1 | -1,797.8 | -586.6 | -543.8 | -501.0 | -757.9 | -804.6 | -854.3 | -907.0 | -962.9 |
| Capital Expenditure, % | -68.57 | -188.24 | -53.47 | -48.14 | -44.11 | -62.86 | -62.86 | -62.86 | -62.86 | -62.86 |
| Tax Rate, % | 9.44 | 9.44 | 9.44 | 9.44 | 9.44 | 9.44 | 9.44 | 9.44 | 9.44 | 9.44 |
| EBITAT | 215.1 | -113.5 | 308.2 | 314.0 | 342.5 | 241.1 | 256.0 | 271.8 | 288.5 | 306.3 |
| Depreciation | ||||||||||
| Changes in Account Receivables | ||||||||||
| Changes in Inventories | ||||||||||
| Changes in Accounts Payable | ||||||||||
| Capital Expenditure | ||||||||||
| UFCF | -54.4 | -1,399.7 | -9.0 | 184.0 | 124.2 | 21.3 | -54.7 | -58.1 | -61.7 | -65.5 |
| WACC, % | 6.14 | 6.23 | 6.13 | 6.12 | 6.14 | 6.15 | 6.15 | 6.15 | 6.15 | 6.15 |
| PV UFCF | ||||||||||
| SUM PV UFCF | -174.3 | |||||||||
| Long Term Growth Rate, % | 4.00 | |||||||||
| Free cash flow (T + 1) | -68 | |||||||||
| Terminal Value | -3,168 | |||||||||
| Present Terminal Value | -2,350 | |||||||||
| Enterprise Value | -2,525 | |||||||||
| Net Debt | 4,560 | |||||||||
| Equity Value | -7,085 | |||||||||
| Diluted Shares Outstanding, MM | 118 | |||||||||
| Equity Value Per Share | -59.96 |
What You Will Get
- Real KRC Financial Data: Pre-filled with Kilroy Realty Corporation’s historical and projected data for precise analysis.
- Fully Editable Template: Modify key inputs like revenue growth, WACC, and EBITDA % with ease.
- Automatic Calculations: See Kilroy Realty Corporation’s intrinsic value update instantly based on your changes.
- Professional Valuation Tool: Designed for investors, analysts, and consultants seeking accurate DCF results.
- User-Friendly Design: Simple structure and clear instructions for all experience levels.
Key Features
- Comprehensive KRC Financials: Gain access to precise historical data and future forecasts tailored for Kilroy Realty Corporation (KRC).
- Adjustable Forecast Parameters: Modify highlighted fields for metrics such as WACC, growth rates, and profit margins.
- Real-Time Calculations: Enjoy automatic updates for DCF, Net Present Value (NPV), and cash flow assessments.
- Interactive Dashboard: User-friendly charts and summaries designed to illustrate your valuation outcomes.
- Suitable for All Skill Levels: A straightforward, intuitive layout crafted for investors, CFOs, and consultants alike.
How It Works
- Step 1: Download the Excel file.
- Step 2: Review pre-entered Kilroy Realty Corporation (KRC) data (historical and projected).
- Step 3: Adjust key assumptions (yellow cells) based on your analysis.
- Step 4: View automatic recalculations for Kilroy Realty Corporation’s intrinsic value.
- Step 5: Use the outputs for investment decisions or reporting.
Why Choose Kilroy Realty Corporation (KRC) Calculator?
- Accuracy: Utilizes real Kilroy Realty financials for precise data.
- Flexibility: Allows users to easily test and adjust inputs as needed.
- Time-Saving: Avoid the complexity of creating a DCF model from the ground up.
- Professional-Grade: Crafted with the expertise and usability expected at the CFO level.
- User-Friendly: Simple to navigate, suitable for users without extensive financial modeling skills.
Who Should Use This Product?
- Investors: Evaluate Kilroy Realty Corporation’s (KRC) valuation before making investment decisions.
- CFOs and Financial Analysts: Optimize valuation methodologies and assess financial forecasts for KRC.
- Real Estate Developers: Understand how publicly traded REITs like Kilroy Realty Corporation are valued.
- Consultants: Provide comprehensive valuation analyses and reports for clients in the real estate sector.
- Students and Educators: Utilize real estate data to practice and teach valuation strategies effectively.
What the Template Contains
- Historical Data: Includes Kilroy Realty Corporation’s past financials and baseline forecasts.
- DCF and Levered DCF Models: Detailed templates to calculate Kilroy Realty Corporation’s intrinsic value.
- WACC Sheet: Pre-built calculations for Weighted Average Cost of Capital.
- Editable Inputs: Modify key drivers like growth rates, EBITDA %, and CAPEX assumptions.
- Quarterly and Annual Statements: A complete breakdown of Kilroy Realty Corporation’s financials.
- Interactive Dashboard: Visualize valuation results and projections dynamically.
Disclaimer
All information, articles, and product details provided on this website are for general informational and educational purposes only. We do not claim any ownership over, nor do we intend to infringe upon, any trademarks, copyrights, logos, brand names, or other intellectual property mentioned or depicted on this site. Such intellectual property remains the property of its respective owners, and any references here are made solely for identification or informational purposes, without implying any affiliation, endorsement, or partnership.
We make no representations or warranties, express or implied, regarding the accuracy, completeness, or suitability of any content or products presented. Nothing on this website should be construed as legal, tax, investment, financial, medical, or other professional advice. In addition, no part of this site—including articles or product references—constitutes a solicitation, recommendation, endorsement, advertisement, or offer to buy or sell any securities, franchises, or other financial instruments, particularly in jurisdictions where such activity would be unlawful.
All content is of a general nature and may not address the specific circumstances of any individual or entity. It is not a substitute for professional advice or services. Any actions you take based on the information provided here are strictly at your own risk. You accept full responsibility for any decisions or outcomes arising from your use of this website and agree to release us from any liability in connection with your use of, or reliance upon, the content or products found herein.