
|
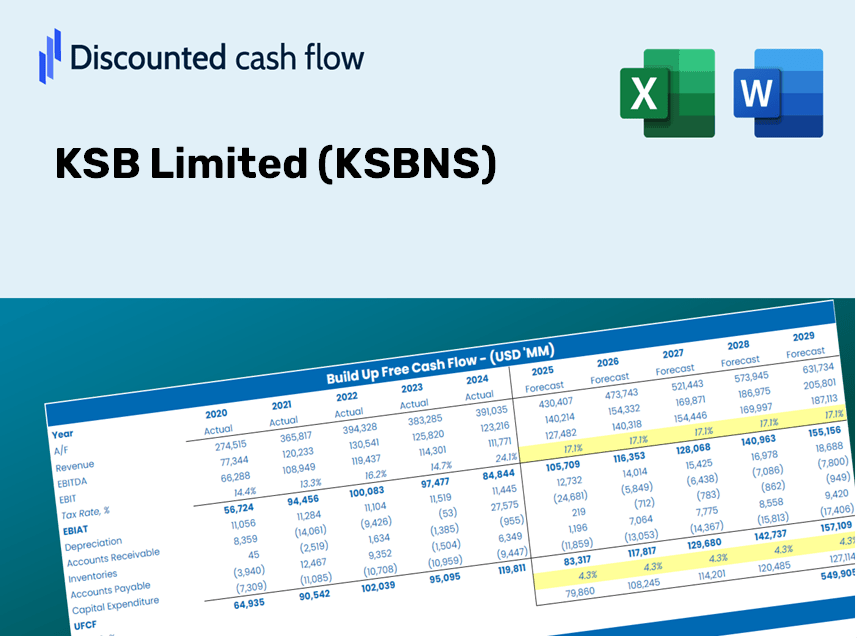
KSB Limited (KSB.NS) DCF Valuation |
Fully Editable: Tailor To Your Needs In Excel Or Sheets
Professional Design: Trusted, Industry-Standard Templates
Investor-Approved Valuation Models
MAC/PC Compatible, Fully Unlocked
No Expertise Is Needed; Easy To Follow
KSB Limited (KSB.NS) Bundle
Streamline your analysis and improve precision with our KSB Limited (KSBNS) DCF Calculator! Utilizing real data from KSB Limited and customizable assumptions, this tool empowers you to forecast, evaluate, and value KSB Limited like a seasoned investor.
Discounted Cash Flow (DCF) - (USD MM)
| Year | AY1 2020 |
AY2 2021 |
AY3 2022 |
AY4 2023 |
AY5 2024 |
FY1 2025 |
FY2 2026 |
FY3 2027 |
FY4 2028 |
FY5 2029 |
|---|---|---|---|---|---|---|---|---|---|---|
| Revenue | 13,934.9 | 18,179.5 | 21,182.7 | 25,182.6 | 29,421.1 | 35,503.4 | 42,843.2 | 51,700.4 | 62,388.7 | 75,286.5 |
| Revenue Growth, % | 0 | 30.46 | 16.52 | 18.88 | 16.83 | 20.67 | 20.67 | 20.67 | 20.67 | 20.67 |
| EBITDA | 1,904.5 | 23,720.5 | 27,187.9 | 32,915.1 | 35,942.0 | 29,373.2 | 35,445.7 | 42,773.5 | 51,616.3 | 62,287.2 |
| EBITDA, % | 13.67 | 130.48 | 128.35 | 130.71 | 122.16 | 82.73 | 82.73 | 82.73 | 82.73 | 82.73 |
| Depreciation | 459.6 | 8,328.3 | 9,309.2 | 9,070.4 | 10,027.9 | 11,585.5 | 13,980.6 | 16,870.9 | 20,358.7 | 24,567.6 |
| Depreciation, % | 3.3 | 45.81 | 43.95 | 36.02 | 34.08 | 32.63 | 32.63 | 32.63 | 32.63 | 32.63 |
| EBIT | 1,444.9 | 15,392.2 | 17,878.7 | 23,844.7 | 25,914.1 | 25,719.1 | 31,036.2 | 37,452.4 | 45,195.1 | 54,538.5 |
| EBIT, % | 10.37 | 84.67 | 84.4 | 94.69 | 88.08 | 72.44 | 72.44 | 72.44 | 72.44 | 72.44 |
| Total Cash | 34,131.2 | 2,915.2 | 1,841.6 | 3,068.5 | 38,021.8 | 16,822.6 | 20,300.4 | 24,497.2 | 29,561.6 | 35,673.0 |
| Total Cash, percent | .0 | .0 | .0 | .0 | .0 | .0 | .0 | .0 | .0 | .0 |
| Account Receivables | 3,076.9 | 3,375.2 | 4,693.0 | 5,510.2 | 77,186.3 | 13,113.7 | 15,824.8 | 19,096.3 | 23,044.2 | 27,808.2 |
| Account Receivables, % | 22.08 | 18.57 | 22.15 | 21.88 | 262.35 | 36.94 | 36.94 | 36.94 | 36.94 | 36.94 |
| Inventories | 4,162.5 | 5,136.9 | 6,523.4 | 7,201.4 | 76,259.7 | 15,445.4 | 18,638.5 | 22,491.8 | 27,141.6 | 32,752.7 |
| Inventories, % | 29.87 | 28.26 | 30.8 | 28.6 | 259.2 | 43.5 | 43.5 | 43.5 | 43.5 | 43.5 |
| Accounts Payable | 24,458.1 | 28,087.8 | 34,321.6 | 33,432.3 | 36,724.5 | 35,503.4 | 42,843.2 | 51,700.4 | 62,388.7 | 75,286.5 |
| Accounts Payable, % | 175.52 | 154.5 | 162.03 | 132.76 | 124.82 | 100 | 100 | 100 | 100 | 100 |
| Capital Expenditure | -8,552.9 | -7,615.9 | -10,542.0 | -10,960.8 | -13,899.1 | -17,311.8 | -20,890.8 | -25,209.6 | -30,421.3 | -36,710.4 |
| Capital Expenditure, % | -61.38 | -41.89 | -49.77 | -43.53 | -47.24 | -48.76 | -48.76 | -48.76 | -48.76 | -48.76 |
| Tax Rate, % | -216.61 | -216.61 | -216.61 | -216.61 | -216.61 | -216.61 | -216.61 | -216.61 | -216.61 | -216.61 |
| EBITAT | -791.7 | 60,808.6 | 68,180.4 | 119,009.0 | 82,046.8 | 20,575.3 | 24,828.9 | 29,961.9 | 36,156.1 | 43,630.8 |
| Depreciation | ||||||||||
| Changes in Account Receivables | ||||||||||
| Changes in Inventories | ||||||||||
| Changes in Accounts Payable | ||||||||||
| Capital Expenditure | ||||||||||
| UFCF | 8,333.8 | 63,878.1 | 70,477.1 | 114,734.1 | -59,266.6 | 138,514.9 | 19,354.4 | 23,355.7 | 28,184.1 | 34,010.7 |
| WACC, % | 0.87436 | 25.81 | 25.81 | 25.81 | 25.81 | 20.82 | 20.82 | 20.82 | 20.82 | 20.82 |
| PV UFCF | ||||||||||
| SUM PV UFCF | 167,578.5 | |||||||||
| Long Term Growth Rate, % | 4.00 | |||||||||
| Free cash flow (T + 1) | 35,371 | |||||||||
| Terminal Value | 210,263 | |||||||||
| Present Terminal Value | 81,663 | |||||||||
| Enterprise Value | 249,242 | |||||||||
| Net Debt | -32,019 | |||||||||
| Equity Value | 281,261 | |||||||||
| Diluted Shares Outstanding, MM | 2 | |||||||||
| Equity Value Per Share | 160,628.85 |
What You Will Receive
- Customizable Excel Template: A fully adaptable Excel-based DCF Calculator featuring pre-filled financial data for KSB Limited (KSBNS).
- Accurate Financial Data: Access to historical figures and forward-looking projections (highlighted in the yellow cells).
- Adjustable Forecasting: Modify key assumptions such as revenue growth, EBITDA margin, and WACC.
- Instant Calculations: Quickly observe how your inputs influence KSB Limited’s (KSBNS) valuation.
- Professional Resource: Designed for investors, CFOs, consultants, and financial analysts.
- Intuitive Interface: Organized for clarity and ease of navigation, complete with step-by-step guidance.
Key Features
- 🔍 Real-Life KSB Limited Financials: Pre-populated historical and projected data for KSB Limited (KSBNS).
- ✏️ Fully Customizable Inputs: Modify all essential parameters (highlighted cells) such as WACC, growth %, and tax rates.
- 📊 Professional DCF Valuation: Integrated formulas calculate KSB's intrinsic value using the Discounted Cash Flow approach.
- ⚡ Instant Results: View KSB's valuation immediately after adjustments are made.
- Scenario Analysis: Examine and compare results for different financial assumptions side-by-side.
How It Works
- Step 1: Download the Excel file.
- Step 2: Review the pre-filled KSB Limited (KSBNS) data (historical and projected).
- Step 3: Modify key assumptions (highlighted in yellow) based on your analysis.
- Step 4: Observe the automatic recalculations for KSB Limited’s (KSBNS) intrinsic value.
- Step 5: Utilize the results for your investment decisions or reporting.
Why Opt for This Calculator?
- Reliable Data: Authentic KSB Limited financials guarantee trustworthy valuation outputs.
- Flexible Settings: Modify essential parameters such as growth rates, WACC, and tax rates to align with your forecasts.
- Efficient: Built-in calculations save you the hassle of starting from the ground up.
- Professional Quality: Tailored for investors, analysts, and consultants alike.
- Easy to Use: Intuitive design and clear, step-by-step guidance make it accessible for everyone.
Who Can Benefit from KSB Limited (KSBNS)?
- Finance Students: Master valuation techniques and apply them using real-world data.
- Academics: Integrate professional valuation models into your research or teaching materials.
- Investors: Validate your investment strategies and analyze valuation results for KSB Limited (KSBNS).
- Analysts: Enhance your productivity with a ready-made, customizable DCF model tailored for KSB Limited (KSBNS).
- Small Business Owners: Discover how established public companies like KSB Limited (KSBNS) are evaluated in the market.
Contents of the Template
- Detailed DCF Model: A customizable template with extensive valuation calculations.
- Real-World Data: KSB Limited’s historical and projected financials loaded for in-depth analysis.
- Customizable Parameters: Modify WACC, growth assumptions, and tax rates to explore different scenarios.
- Financial Statements: Complete annual and quarterly reports for a more thorough understanding.
- Key Metrics: Integrated analysis for profitability, efficiency, and leverage ratios.
- Dashboard with Visual Outputs: Graphs and tables for clear and actionable insights.
Disclaimer
All information, articles, and product details provided on this website are for general informational and educational purposes only. We do not claim any ownership over, nor do we intend to infringe upon, any trademarks, copyrights, logos, brand names, or other intellectual property mentioned or depicted on this site. Such intellectual property remains the property of its respective owners, and any references here are made solely for identification or informational purposes, without implying any affiliation, endorsement, or partnership.
We make no representations or warranties, express or implied, regarding the accuracy, completeness, or suitability of any content or products presented. Nothing on this website should be construed as legal, tax, investment, financial, medical, or other professional advice. In addition, no part of this site—including articles or product references—constitutes a solicitation, recommendation, endorsement, advertisement, or offer to buy or sell any securities, franchises, or other financial instruments, particularly in jurisdictions where such activity would be unlawful.
All content is of a general nature and may not address the specific circumstances of any individual or entity. It is not a substitute for professional advice or services. Any actions you take based on the information provided here are strictly at your own risk. You accept full responsibility for any decisions or outcomes arising from your use of this website and agree to release us from any liability in connection with your use of, or reliance upon, the content or products found herein.