
|
Standard BioTools Inc. (LAB) DCF Valuation |
Fully Editable: Tailor To Your Needs In Excel Or Sheets
Professional Design: Trusted, Industry-Standard Templates
Investor-Approved Valuation Models
MAC/PC Compatible, Fully Unlocked
No Expertise Is Needed; Easy To Follow
Standard BioTools Inc. (LAB) Bundle
Optimize your time and improve precision with our (LAB) DCF Calculator! Utilizing authentic Standard BioTools Inc. data and customizable assumptions, this tool enables you to forecast, analyze, and value (LAB) just like a seasoned investor.
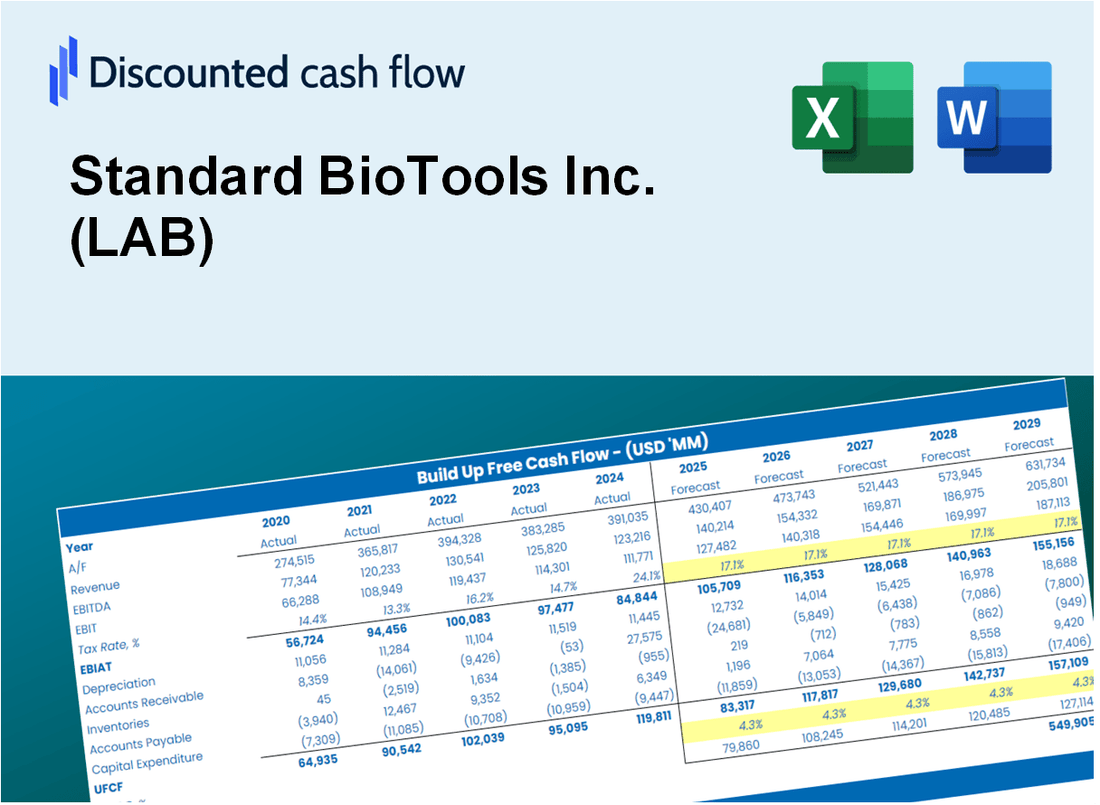
Discounted Cash Flow (DCF) - (USD MM)
| Year | AY1 2020 |
AY2 2021 |
AY3 2022 |
AY4 2023 |
AY5 2024 |
FY1 2025 |
FY2 2026 |
FY3 2027 |
FY4 2028 |
FY5 2029 |
|---|---|---|---|---|---|---|---|---|---|---|
| Revenue | 138.1 | 130.6 | 97.9 | 106.3 | 174.4 | 192.8 | 213.1 | 235.6 | 260.4 | 287.8 |
| Revenue Growth, % | 0 | -5.47 | -24.99 | 8.57 | 64.03 | 10.53 | 10.53 | 10.53 | 10.53 | 10.53 |
| EBITDA | -34.6 | -44.3 | -173.6 | -54.5 | -118.1 | -107.2 | -118.4 | -130.9 | -144.7 | -160.0 |
| EBITDA, % | -25.05 | -33.9 | -177.21 | -51.21 | -67.73 | -55.58 | -55.58 | -55.58 | -55.58 | -55.58 |
| Depreciation | 15.9 | 15.6 | 15.0 | 15.2 | 16.9 | 24.2 | 26.7 | 29.6 | 32.7 | 36.1 |
| Depreciation, % | 11.53 | 11.92 | 15.34 | 14.27 | 9.67 | 12.55 | 12.55 | 12.55 | 12.55 | 12.55 |
| EBIT | -50.5 | -59.8 | -188.6 | -69.6 | -135.0 | -125.4 | -138.6 | -153.2 | -169.4 | -187.2 |
| EBIT, % | -36.58 | -45.82 | -192.55 | -65.49 | -77.39 | -65.06 | -65.06 | -65.06 | -65.06 | -65.06 |
| Total Cash | 68.5 | 28.5 | 165.8 | 114.9 | 292.9 | 143.2 | 158.3 | 175.0 | 193.4 | 213.8 |
| Total Cash, percent | .0 | .0 | .0 | .0 | .0 | .0 | .0 | .0 | .0 | .0 |
| Account Receivables | 25.4 | 18.3 | 17.3 | 19.7 | 33.6 | 33.9 | 37.4 | 41.4 | 45.7 | 50.6 |
| Account Receivables, % | 18.4 | 14.03 | 17.64 | 18.49 | 19.27 | 17.57 | 17.57 | 17.57 | 17.57 | 17.57 |
| Inventories | 19.7 | 20.8 | 21.5 | 20.5 | 40.7 | 36.6 | 40.4 | 44.7 | 49.4 | 54.6 |
| Inventories, % | 14.25 | 15.95 | 21.92 | 19.31 | 23.35 | 18.96 | 18.96 | 18.96 | 18.96 | 18.96 |
| Accounts Payable | 9.2 | 10.6 | 7.9 | 9.2 | 12.3 | 14.9 | 16.5 | 18.2 | 20.1 | 22.2 |
| Accounts Payable, % | 6.67 | 8.12 | 8.08 | 8.69 | 7.04 | 7.72 | 7.72 | 7.72 | 7.72 | 7.72 |
| Capital Expenditure | -12.7 | -13.3 | -3.8 | -2.8 | -8.4 | -11.8 | -13.1 | -14.5 | -16.0 | -17.7 |
| Capital Expenditure, % | -9.21 | -10.16 | -3.91 | -2.66 | -4.79 | -6.14 | -6.14 | -6.14 | -6.14 | -6.14 |
| Tax Rate, % | -0.41428 | -0.41428 | -0.41428 | -0.41428 | -0.41428 | -0.41428 | -0.41428 | -0.41428 | -0.41428 | -0.41428 |
| EBITAT | -49.5 | -55.7 | -185.8 | -70.1 | -135.6 | -122.8 | -135.8 | -150.1 | -165.9 | -183.3 |
| Depreciation | ||||||||||
| Changes in Account Receivables | ||||||||||
| Changes in Inventories | ||||||||||
| Changes in Accounts Payable | ||||||||||
| Capital Expenditure | ||||||||||
| UFCF | -82.2 | -46.0 | -176.9 | -57.8 | -158.2 | -103.9 | -128.0 | -141.4 | -156.3 | -172.8 |
| WACC, % | 9.7 | 9.66 | 9.7 | 9.71 | 9.71 | 9.7 | 9.7 | 9.7 | 9.7 | 9.7 |
| PV UFCF | ||||||||||
| SUM PV UFCF | -525.0 | |||||||||
| Long Term Growth Rate, % | 2.00 | |||||||||
| Free cash flow (T + 1) | -176 | |||||||||
| Terminal Value | -2,290 | |||||||||
| Present Terminal Value | -1,441 | |||||||||
| Enterprise Value | -1,966 | |||||||||
| Net Debt | -134 | |||||||||
| Equity Value | -1,833 | |||||||||
| Diluted Shares Outstanding, MM | 353 | |||||||||
| Equity Value Per Share | -5.20 |
What You Will Get
- Editable Excel Template: A fully customizable Excel-based DCF Calculator featuring pre-filled real LAB financials.
- Real-World Data: Access to historical data and forward-looking estimates (highlighted in the yellow cells).
- Forecast Flexibility: Adjust forecast assumptions such as revenue growth, EBITDA %, and WACC.
- Automatic Calculations: Instantly observe the effects of your inputs on Standard BioTools Inc.'s valuation.
- Professional Tool: Designed for investors, CFOs, consultants, and financial analysts.
- User-Friendly Design: Organized for clarity and ease of use, complete with step-by-step instructions.
Key Features
- Comprehensive DCF Calculator: Offers detailed unlevered and levered DCF valuation models tailored for Standard BioTools Inc. (LAB).
- WACC Calculator: Features a pre-built Weighted Average Cost of Capital sheet with adjustable inputs specific to the biotech sector.
- Customizable Forecast Assumptions: Easily alter growth rates, capital expenditures, and discount rates according to your analysis needs.
- Integrated Financial Ratios: Evaluate profitability, leverage, and efficiency ratios relevant to Standard BioTools Inc. (LAB).
- Interactive Dashboard and Charts: Visual representations summarize essential valuation metrics for straightforward analysis.
How It Works
- Download the Template: Gain immediate access to the Excel-based LAB DCF Calculator.
- Input Your Assumptions: Modify the yellow-highlighted cells for growth rates, WACC, margins, and other variables.
- Instant Calculations: The model automatically recalculates Standard BioTools Inc.’s intrinsic value.
- Test Scenarios: Explore various assumptions to assess potential changes in valuation.
- Analyze and Decide: Utilize the outcomes to inform your investment or financial analysis.
Why Choose This Calculator for Standard BioTools Inc. (LAB)?
- Accurate Data: Real Standard BioTools Inc. financials provide trustworthy valuation outcomes.
- Customizable: Modify essential parameters such as growth rates, WACC, and tax rates to fit your forecasts.
- Time-Saving: Pre-configured calculations save you the hassle of starting from the beginning.
- Professional-Grade Tool: Tailored for investors, analysts, and consultants in the biotech sector.
- User-Friendly: Clear layout and guided instructions ensure accessibility for all users.
Who Should Use Standard BioTools Inc. (LAB)?
- Researchers: Enhance your experiments with advanced tools for biological analysis.
- Laboratory Managers: Streamline operations using our comprehensive product suite tailored for efficiency.
- Biotechnology Firms: Integrate our solutions into your workflows for improved data accuracy.
- Students and Educators: Utilize our resources for hands-on learning in biology and biotechnology courses.
- Healthcare Professionals: Leverage our innovative technologies to support diagnostics and patient care.
What the Template Contains
- Comprehensive DCF Model: Editable template featuring detailed valuation calculations.
- Real-World Data: Standard BioTools Inc.'s (LAB) historical and projected financials preloaded for analysis.
- Customizable Parameters: Modify WACC, growth rates, and tax assumptions to explore various scenarios.
- Financial Statements: Complete annual and quarterly breakdowns for enhanced insights.
- Key Ratios: Integrated analysis for profitability, efficiency, and leverage metrics.
- Dashboard with Visual Outputs: Charts and tables that provide clear, actionable results.
Disclaimer
All information, articles, and product details provided on this website are for general informational and educational purposes only. We do not claim any ownership over, nor do we intend to infringe upon, any trademarks, copyrights, logos, brand names, or other intellectual property mentioned or depicted on this site. Such intellectual property remains the property of its respective owners, and any references here are made solely for identification or informational purposes, without implying any affiliation, endorsement, or partnership.
We make no representations or warranties, express or implied, regarding the accuracy, completeness, or suitability of any content or products presented. Nothing on this website should be construed as legal, tax, investment, financial, medical, or other professional advice. In addition, no part of this site—including articles or product references—constitutes a solicitation, recommendation, endorsement, advertisement, or offer to buy or sell any securities, franchises, or other financial instruments, particularly in jurisdictions where such activity would be unlawful.
All content is of a general nature and may not address the specific circumstances of any individual or entity. It is not a substitute for professional advice or services. Any actions you take based on the information provided here are strictly at your own risk. You accept full responsibility for any decisions or outcomes arising from your use of this website and agree to release us from any liability in connection with your use of, or reliance upon, the content or products found herein.