
|
Lazard Ltd (LAZ) DCF Valuation |
Fully Editable: Tailor To Your Needs In Excel Or Sheets
Professional Design: Trusted, Industry-Standard Templates
Investor-Approved Valuation Models
MAC/PC Compatible, Fully Unlocked
No Expertise Is Needed; Easy To Follow
Lazard Ltd (LAZ) Bundle
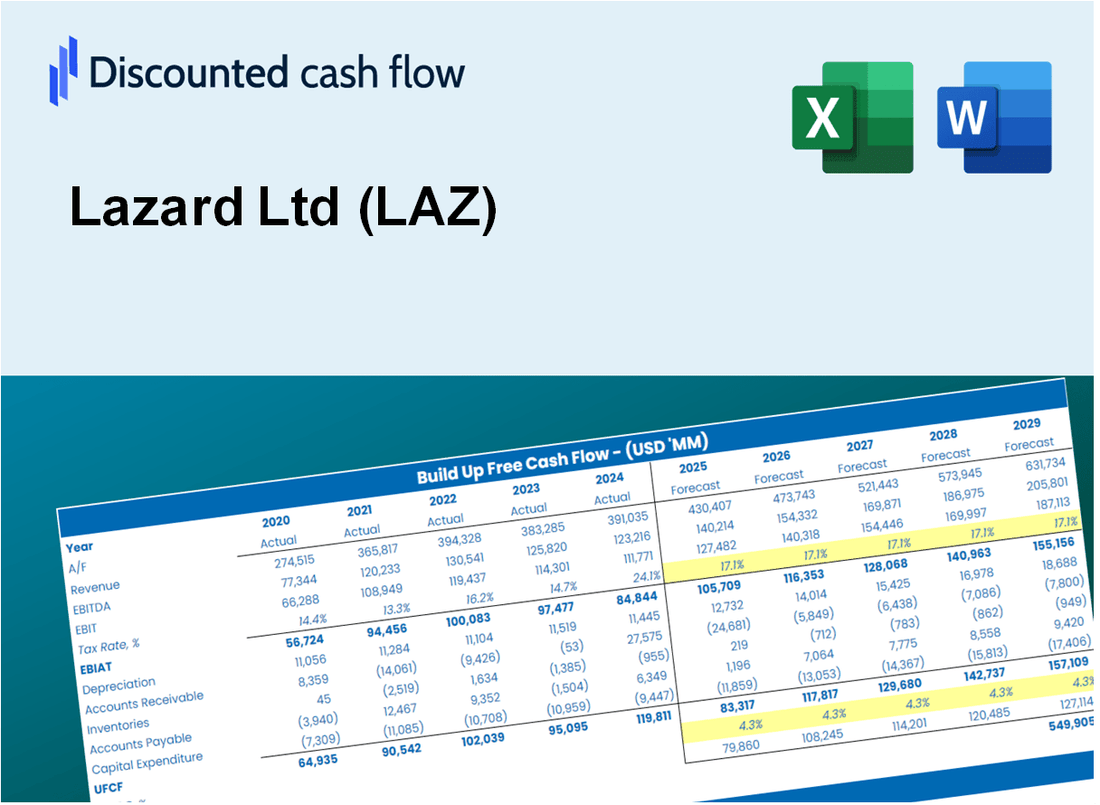
Gain insight into your Lazard Ltd (LAZ) valuation analysis using our sophisticated DCF Calculator! This Excel template comes preloaded with accurate Lazard Ltd (LAZ) data, enabling you to modify forecasts and assumptions to determine the intrinsic value of Lazard Ltd (LAZ) with precision.
Discounted Cash Flow (DCF) - (USD MM)
| Year | AY1 2020 |
AY2 2021 |
AY3 2022 |
AY4 2023 |
AY5 2024 |
FY1 2025 |
FY2 2026 |
FY3 2027 |
FY4 2028 |
FY5 2029 |
|---|---|---|---|---|---|---|---|---|---|---|
| Revenue | 2,641.1 | 3,268.3 | 2,825.6 | 2,551.1 | 3,086.3 | 3,251.9 | 3,426.4 | 3,610.3 | 3,804.1 | 4,008.2 |
| Revenue Growth, % | 0 | 23.75 | -13.54 | -9.71 | 20.98 | 5.37 | 5.37 | 5.37 | 5.37 | 5.37 |
| EBITDA | 619.7 | 843.0 | 640.8 | 40.9 | 511.3 | 586.0 | 617.5 | 650.6 | 685.5 | 722.3 |
| EBITDA, % | 23.46 | 25.79 | 22.68 | 1.6 | 16.57 | 18.02 | 18.02 | 18.02 | 18.02 | 18.02 |
| Depreciation | 36.9 | 38.4 | 42.3 | 43.2 | 36.5 | 45.2 | 47.6 | 50.2 | 52.8 | 55.7 |
| Depreciation, % | 1.4 | 1.17 | 1.5 | 1.69 | 1.18 | 1.39 | 1.39 | 1.39 | 1.39 | 1.39 |
| EBIT | 582.8 | 804.6 | 598.4 | -2.3 | 474.8 | 540.8 | 569.9 | 600.4 | 632.7 | 666.6 |
| EBIT, % | 22.07 | 24.62 | 21.18 | -0.0895286 | 15.38 | 16.63 | 16.63 | 16.63 | 16.63 | 16.63 |
| Total Cash | 2,524.3 | 2,812.6 | 2,014.0 | 1,190.9 | 1,576.9 | 2,280.8 | 2,403.2 | 2,532.2 | 2,668.1 | 2,811.2 |
| Total Cash, percent | .0 | .0 | .0 | .0 | .0 | .0 | .0 | .0 | .0 | .0 |
| Account Receivables | 792.3 | 855.1 | 652.8 | 832.0 | 800.3 | 896.3 | 944.4 | 995.1 | 1,048.5 | 1,104.7 |
| Account Receivables, % | 30 | 26.16 | 23.1 | 32.61 | 25.93 | 27.56 | 27.56 | 27.56 | 27.56 | 27.56 |
| Inventories | -183.9 | .0 | -217.8 | .0 | .0 | -95.4 | -100.5 | -105.9 | -111.6 | -117.6 |
| Inventories, % | -6.96 | 0 | -7.71 | 0 | 0 | -2.93 | -2.93 | -2.93 | -2.93 | -2.93 |
| Accounts Payable | .0 | .0 | .0 | .0 | .0 | .0 | .0 | .0 | .0 | .0 |
| Accounts Payable, % | 0 | 0 | 0 | 0 | 0 | 0 | 0 | 0 | 0 | 0 |
| Capital Expenditure | -64.3 | -39.7 | -49.5 | -28.3 | -45.5 | -51.9 | -54.7 | -57.7 | -60.7 | -64.0 |
| Capital Expenditure, % | -2.43 | -1.21 | -1.75 | -1.11 | -1.47 | -1.6 | -1.6 | -1.6 | -1.6 | -1.6 |
| Tax Rate, % | 27.57 | 27.57 | 27.57 | 27.57 | 27.57 | 27.57 | 27.57 | 27.57 | 27.57 | 27.57 |
| EBITAT | 467.1 | 587.0 | 413.9 | -2.2 | 343.9 | 420.9 | 443.5 | 467.3 | 492.3 | 518.8 |
| Depreciation | ||||||||||
| Changes in Account Receivables | ||||||||||
| Changes in Inventories | ||||||||||
| Changes in Accounts Payable | ||||||||||
| Capital Expenditure | ||||||||||
| UFCF | -168.7 | 339.0 | 826.9 | -384.4 | 366.6 | 413.6 | 393.4 | 414.5 | 436.7 | 460.2 |
| WACC, % | 8.16 | 8.08 | 8.03 | 8.34 | 8.07 | 8.14 | 8.14 | 8.14 | 8.14 | 8.14 |
| PV UFCF | ||||||||||
| SUM PV UFCF | 1,677.2 | |||||||||
| Long Term Growth Rate, % | 2.00 | |||||||||
| Free cash flow (T + 1) | 469 | |||||||||
| Terminal Value | 7,649 | |||||||||
| Present Terminal Value | 5,173 | |||||||||
| Enterprise Value | 6,850 | |||||||||
| Net Debt | 884 | |||||||||
| Equity Value | 5,966 | |||||||||
| Diluted Shares Outstanding, MM | 102 | |||||||||
| Equity Value Per Share | 58.26 |
What You Will Get
- Real LAZ Financial Data: Pre-filled with Lazard Ltd’s historical and projected data for precise analysis.
- Fully Editable Template: Modify key inputs like revenue growth, WACC, and EBITDA % with ease.
- Automatic Calculations: See Lazard Ltd’s intrinsic value update instantly based on your changes.
- Professional Valuation Tool: Designed for investors, analysts, and consultants seeking accurate DCF results.
- User-Friendly Design: Simple structure and clear instructions for all experience levels.
Key Features
- Customizable Financial Inputs: Adjust essential metrics such as revenue projections, operating margins, and investment costs.
- Instant DCF Valuation: Generates intrinsic value, NPV, and other financial metrics in real-time.
- High-Precision Results: Leverages Lazard's (LAZ) actual financial data for accurate valuation assessments.
- Effortless Scenario Testing: Explore various assumptions and easily analyze different outcomes.
- Efficiency Booster: Remove the hassle of constructing intricate valuation models from the ground up.
How It Works
- 1. Access the Template: Download and open the Excel file featuring Lazard Ltd's (LAZ) financial data.
- 2. Adjust Assumptions: Modify essential inputs such as growth projections, WACC, and capital investments.
- 3. Analyze Results Immediately: The DCF model swiftly computes intrinsic value and NPV based on your inputs.
- 4. Explore Scenarios: Evaluate various forecasts to assess different valuation possibilities.
- 5. Present with Assurance: Deliver expert valuation analyses to bolster your decision-making process.
Why Choose Lazard Ltd (LAZ)?
- Expert Insights: Benefit from in-depth analysis and strategic advice from industry leaders.
- Global Reach: Access a vast network of resources and expertise across multiple markets.
- Tailored Solutions: Customized financial strategies designed to meet your unique needs.
- Proven Track Record: Trust in our history of successful outcomes and satisfied clients.
- Commitment to Excellence: Dedicated to delivering high-quality service and innovative solutions.
Who Should Use This Product?
- Investors: Accurately assess Lazard Ltd's (LAZ) intrinsic value before making investment choices.
- CFOs: Utilize a high-quality DCF model for comprehensive financial reporting and analysis.
- Consultants: Efficiently customize the template for client valuation reports.
- Entrepreneurs: Acquire knowledge on financial modeling practices utilized by top-tier financial firms.
- Educators: Employ it as a resource to illustrate various valuation techniques.
What the Template Contains
- Pre-Filled DCF Model: Lazard Ltd’s (LAZ) financial data preloaded for immediate use.
- WACC Calculator: Detailed calculations for Weighted Average Cost of Capital.
- Financial Ratios: Evaluate Lazard Ltd’s (LAZ) profitability, leverage, and efficiency.
- Editable Inputs: Change assumptions such as growth, margins, and CAPEX to fit your scenarios.
- Financial Statements: Annual and quarterly reports to support detailed analysis.
- Interactive Dashboard: Easily visualize key valuation metrics and results.
Disclaimer
All information, articles, and product details provided on this website are for general informational and educational purposes only. We do not claim any ownership over, nor do we intend to infringe upon, any trademarks, copyrights, logos, brand names, or other intellectual property mentioned or depicted on this site. Such intellectual property remains the property of its respective owners, and any references here are made solely for identification or informational purposes, without implying any affiliation, endorsement, or partnership.
We make no representations or warranties, express or implied, regarding the accuracy, completeness, or suitability of any content or products presented. Nothing on this website should be construed as legal, tax, investment, financial, medical, or other professional advice. In addition, no part of this site—including articles or product references—constitutes a solicitation, recommendation, endorsement, advertisement, or offer to buy or sell any securities, franchises, or other financial instruments, particularly in jurisdictions where such activity would be unlawful.
All content is of a general nature and may not address the specific circumstances of any individual or entity. It is not a substitute for professional advice or services. Any actions you take based on the information provided here are strictly at your own risk. You accept full responsibility for any decisions or outcomes arising from your use of this website and agree to release us from any liability in connection with your use of, or reliance upon, the content or products found herein.