
|
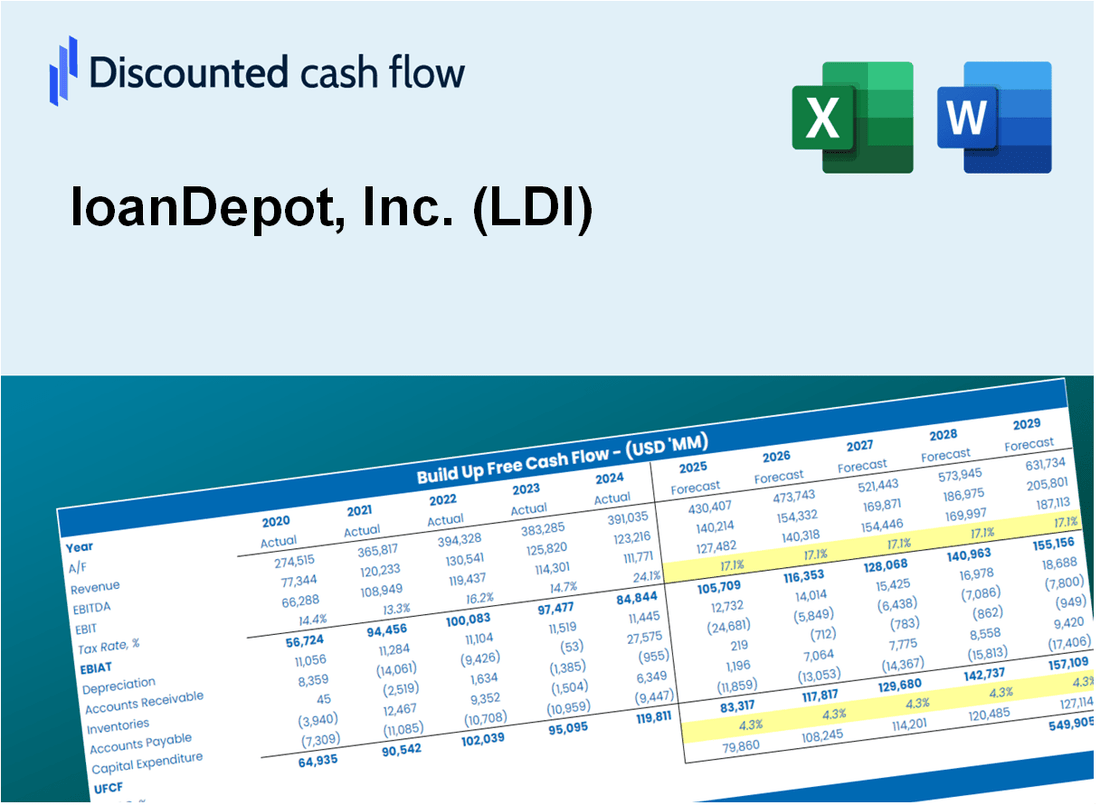
loanDepot, Inc. (LDI) DCF Valuation |
Fully Editable: Tailor To Your Needs In Excel Or Sheets
Professional Design: Trusted, Industry-Standard Templates
Investor-Approved Valuation Models
MAC/PC Compatible, Fully Unlocked
No Expertise Is Needed; Easy To Follow
loanDepot, Inc. (LDI) Bundle
If you're an investor or analyst, this loanDepot, Inc. (LDI) DCF Calculator is the perfect tool for accurate valuation. Packed with real data from loanDepot, you can adjust forecasts and view the effects in real-time.
Discounted Cash Flow (DCF) - (USD MM)
| Year | AY1 2020 |
AY2 2021 |
AY3 2022 |
AY4 2023 |
AY5 2024 |
FY1 2025 |
FY2 2026 |
FY3 2027 |
FY4 2028 |
FY5 2029 |
|---|---|---|---|---|---|---|---|---|---|---|
| Revenue | 4,344.8 | 3,757.1 | 1,412.3 | 1,043.5 | 1,117.0 | 851.7 | 649.4 | 495.1 | 377.5 | 287.9 |
| Revenue Growth, % | 0 | -13.53 | -62.41 | -26.11 | 7.04 | -23.75 | -23.75 | -23.75 | -23.75 | -23.75 |
| EBITDA | 2,076.1 | 724.7 | -627.0 | -222.9 | -195.7 | -27.6 | -21.1 | -16.1 | -12.2 | -9.3 |
| EBITDA, % | 47.78 | 19.29 | -44.4 | -21.36 | -17.52 | -3.24 | -3.24 | -3.24 | -3.24 | -3.24 |
| Depreciation | 60.7 | 58.2 | 63.0 | 55.4 | 47.1 | 28.8 | 22.0 | 16.8 | 12.8 | 9.7 |
| Depreciation, % | 1.4 | 1.55 | 4.46 | 5.31 | 4.22 | 3.39 | 3.39 | 3.39 | 3.39 | 3.39 |
| EBIT | 2,015.4 | 666.5 | -690.0 | -278.3 | -242.8 | -56.5 | -43.0 | -32.8 | -25.0 | -19.1 |
| EBIT, % | 46.39 | 17.74 | -48.85 | -26.67 | -21.74 | -6.63 | -6.63 | -6.63 | -6.63 | -6.63 |
| Total Cash | 284.2 | 419.6 | 864.0 | 660.7 | 421.6 | 306.5 | 233.7 | 178.2 | 135.9 | 103.6 |
| Total Cash, percent | .0 | .0 | .0 | .0 | .0 | .0 | .0 | .0 | .0 | .0 |
| Account Receivables | 138.1 | 56.2 | 160.3 | 106.2 | 82.8 | 57.3 | 43.7 | 33.3 | 25.4 | 19.4 |
| Account Receivables, % | 3.18 | 1.5 | 11.35 | 10.18 | 7.41 | 6.72 | 6.72 | 6.72 | 6.72 | 6.72 |
| Inventories | .0 | .0 | .0 | .0 | .0 | .0 | .0 | .0 | .0 | .0 |
| Inventories, % | 0 | 0 | 0 | 0 | 0 | 0 | 0 | 0 | 0 | 0 |
| Accounts Payable | 151.5 | 181.2 | 226.9 | 168.2 | 187.7 | 97.6 | 74.4 | 56.7 | 43.3 | 33.0 |
| Accounts Payable, % | 3.49 | 4.82 | 16.07 | 16.12 | 16.81 | 11.46 | 11.46 | 11.46 | 11.46 | 11.46 |
| Capital Expenditure | -33.9 | -54.1 | -43.2 | -20.6 | -26.4 | -16.4 | -12.5 | -9.5 | -7.3 | -5.5 |
| Capital Expenditure, % | -0.78035 | -1.44 | -3.06 | -1.98 | -2.36 | -1.92 | -1.92 | -1.92 | -1.92 | -1.92 |
| Tax Rate, % | 59.51 | 59.51 | 59.51 | 59.51 | 59.51 | 59.51 | 59.51 | 59.51 | 59.51 | 59.51 |
| EBITAT | .0 | 113.5 | -273.0 | -110.1 | -98.3 | -15.4 | -11.8 | -9.0 | -6.8 | -5.2 |
| Depreciation | ||||||||||
| Changes in Account Receivables | ||||||||||
| Changes in Inventories | ||||||||||
| Changes in Accounts Payable | ||||||||||
| Capital Expenditure | ||||||||||
| UFCF | 40.2 | 229.1 | -311.7 | -80.0 | -34.6 | -67.6 | -11.8 | -9.0 | -6.9 | -5.3 |
| WACC, % | 1.48 | 2.45 | 3.73 | 3.73 | 3.78 | 3.04 | 3.04 | 3.04 | 3.04 | 3.04 |
| PV UFCF | ||||||||||
| SUM PV UFCF | -95.6 | |||||||||
| Long Term Growth Rate, % | 2.00 | |||||||||
| Free cash flow (T + 1) | -5 | |||||||||
| Terminal Value | -517 | |||||||||
| Present Terminal Value | -445 | |||||||||
| Enterprise Value | -541 | |||||||||
| Net Debt | 5,011 | |||||||||
| Equity Value | -5,552 | |||||||||
| Diluted Shares Outstanding, MM | 186 | |||||||||
| Equity Value Per Share | -29.91 |
What You Will Get
- Real LDI Financial Data: Pre-filled with loanDepot’s historical and projected data for precise analysis.
- Fully Editable Template: Modify key inputs like revenue growth, WACC, and EBITDA % with ease.
- Automatic Calculations: See loanDepot’s intrinsic value update instantly based on your changes.
- Professional Valuation Tool: Designed for investors, analysts, and consultants seeking accurate DCF results.
- User-Friendly Design: Simple structure and clear instructions for all experience levels.
Key Features
- 🔍 Real-Life LDI Financials: Pre-filled historical and projected data for loanDepot, Inc. (LDI).
- ✏️ Fully Customizable Inputs: Adjust all critical parameters (yellow cells) like WACC, growth %, and tax rates.
- 📊 Professional DCF Valuation: Built-in formulas calculate loanDepot’s intrinsic value using the Discounted Cash Flow method.
- ⚡ Instant Results: Visualize loanDepot’s valuation instantly after making changes.
- Scenario Analysis: Test and compare outcomes for various financial assumptions side-by-side.
How It Works
- 1. Access the Template: Download and open the Excel file containing loanDepot, Inc.'s (LDI) preloaded financial data.
- 2. Adjust Key Variables: Modify essential inputs such as interest rates, loan growth projections, and operational expenses.
- 3. Analyze Results in Real-Time: The financial model automatically computes intrinsic value and net present value (NPV).
- 4. Explore Different Scenarios: Evaluate various forecasts to understand different valuation possibilities.
- 5. Present with Assurance: Share professional valuation analyses to enhance your decision-making process.
Why Choose This Calculator for loanDepot, Inc. (LDI)?
- All-in-One Solution: Combines DCF, WACC, and financial ratio assessments in a single interface.
- Flexible Inputs: Modify the highlighted cells to explore different financial scenarios.
- In-Depth Analysis: Automatically computes loanDepot’s intrinsic value and Net Present Value.
- Preloaded Information: Access to historical and projected data for reliable analysis.
- Expert-Level Tool: Perfect for financial analysts, investors, and business advisors.
Who Should Use This Product?
- Homebuyers: Make informed decisions about mortgage options and rates with loanDepot's resources.
- Real Estate Investors: Analyze potential investments and financing strategies effectively.
- Mortgage Brokers: Provide clients with comprehensive loan solutions and competitive offers.
- Financial Advisors: Guide clients through the mortgage process to achieve their homeownership goals.
- Students in Finance: Gain practical knowledge of mortgage lending and real estate financing with real-world examples.
What the Template Contains
- Historical Data: Includes loanDepot’s past financials and baseline forecasts.
- DCF and Levered DCF Models: Detailed templates to calculate loanDepot’s intrinsic value.
- WACC Sheet: Pre-built calculations for Weighted Average Cost of Capital.
- Editable Inputs: Modify key drivers like growth rates, EBITDA %, and CAPEX assumptions.
- Quarterly and Annual Statements: A complete breakdown of loanDepot’s financials.
- Interactive Dashboard: Visualize valuation results and projections dynamically.
Disclaimer
All information, articles, and product details provided on this website are for general informational and educational purposes only. We do not claim any ownership over, nor do we intend to infringe upon, any trademarks, copyrights, logos, brand names, or other intellectual property mentioned or depicted on this site. Such intellectual property remains the property of its respective owners, and any references here are made solely for identification or informational purposes, without implying any affiliation, endorsement, or partnership.
We make no representations or warranties, express or implied, regarding the accuracy, completeness, or suitability of any content or products presented. Nothing on this website should be construed as legal, tax, investment, financial, medical, or other professional advice. In addition, no part of this site—including articles or product references—constitutes a solicitation, recommendation, endorsement, advertisement, or offer to buy or sell any securities, franchises, or other financial instruments, particularly in jurisdictions where such activity would be unlawful.
All content is of a general nature and may not address the specific circumstances of any individual or entity. It is not a substitute for professional advice or services. Any actions you take based on the information provided here are strictly at your own risk. You accept full responsibility for any decisions or outcomes arising from your use of this website and agree to release us from any liability in connection with your use of, or reliance upon, the content or products found herein.