
|
Lear Corporation (LEA) DCF Valuation |
Fully Editable: Tailor To Your Needs In Excel Or Sheets
Professional Design: Trusted, Industry-Standard Templates
Investor-Approved Valuation Models
MAC/PC Compatible, Fully Unlocked
No Expertise Is Needed; Easy To Follow
Lear Corporation (LEA) Bundle
Whether you're an investor or analyst, this Lear Corporation (LEA) DCF Calculator is your go-to resource for accurate valuation. Loaded with real data from Lear Corporation, you can adjust forecasts and observe the effects in real time.
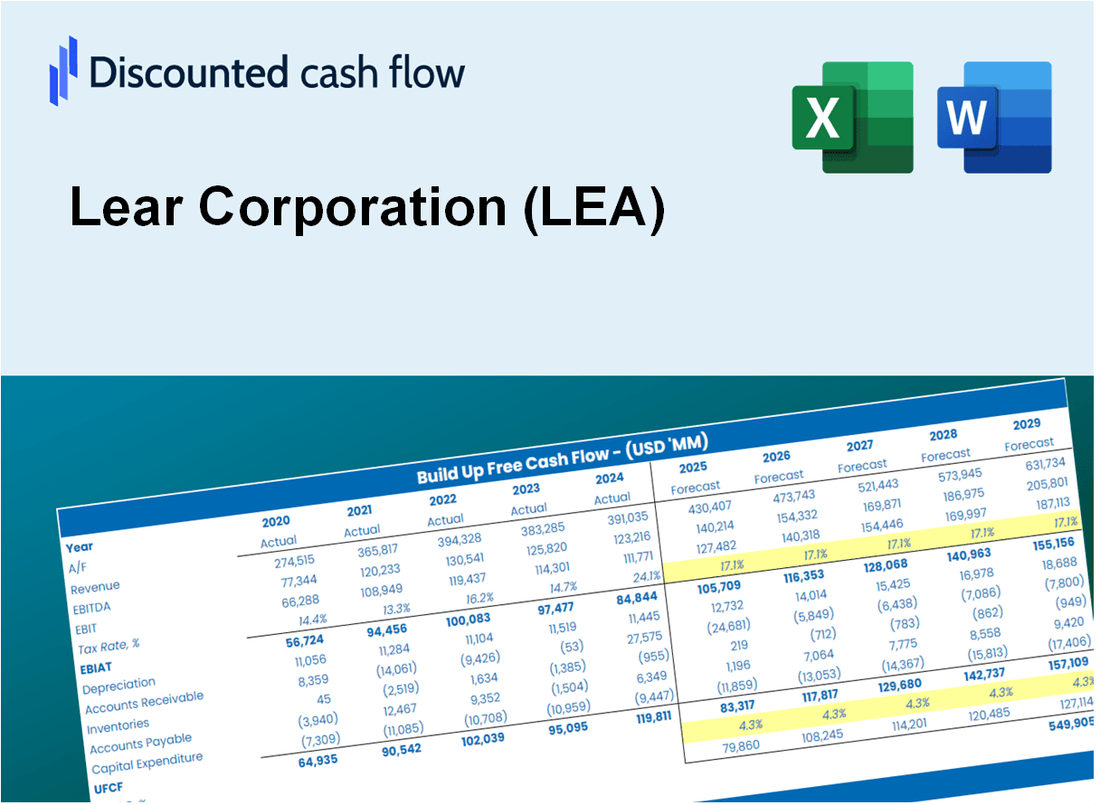
Discounted Cash Flow (DCF) - (USD MM)
| Year | AY1 2020 |
AY2 2021 |
AY3 2022 |
AY4 2023 |
AY5 2024 |
FY1 2025 |
FY2 2026 |
FY3 2027 |
FY4 2028 |
FY5 2029 |
|---|---|---|---|---|---|---|---|---|---|---|
| Revenue | 17,045.5 | 19,263.1 | 20,891.5 | 23,466.9 | 23,306.0 | 25,234.9 | 27,323.4 | 29,584.8 | 32,033.3 | 34,684.5 |
| Revenue Growth, % | 0 | 13.01 | 8.45 | 12.33 | -0.68565 | 8.28 | 8.28 | 8.28 | 8.28 | 8.28 |
| EBITDA | 938.8 | 1,246.8 | 1,182.0 | 1,656.5 | 1,457.4 | 1,562.0 | 1,691.3 | 1,831.3 | 1,982.9 | 2,147.0 |
| EBITDA, % | 5.51 | 6.47 | 5.66 | 7.06 | 6.25 | 6.19 | 6.19 | 6.19 | 6.19 | 6.19 |
| Depreciation | 539.9 | 573.9 | 576.5 | 602.5 | 620.7 | 713.5 | 772.5 | 836.5 | 905.7 | 980.7 |
| Depreciation, % | 3.17 | 2.98 | 2.76 | 2.57 | 2.66 | 2.83 | 2.83 | 2.83 | 2.83 | 2.83 |
| EBIT | 398.9 | 672.9 | 605.5 | 1,054.0 | 836.7 | 848.6 | 918.8 | 994.8 | 1,077.2 | 1,166.3 |
| EBIT, % | 2.34 | 3.49 | 2.9 | 4.49 | 3.59 | 3.36 | 3.36 | 3.36 | 3.36 | 3.36 |
| Total Cash | 1,316.0 | 1,318.3 | 1,114.9 | 1,196.3 | 1,059.5 | 1,491.1 | 1,614.5 | 1,748.1 | 1,892.8 | 2,049.5 |
| Total Cash, percent | .0 | .0 | .0 | .0 | .0 | .0 | .0 | .0 | .0 | .0 |
| Account Receivables | 3,269.2 | 3,041.5 | 3,451.9 | 3,681.2 | 3,589.3 | 4,167.7 | 4,512.7 | 4,886.2 | 5,290.6 | 5,728.4 |
| Account Receivables, % | 19.18 | 15.79 | 16.52 | 15.69 | 15.4 | 16.52 | 16.52 | 16.52 | 16.52 | 16.52 |
| Inventories | 1,401.1 | 1,571.9 | 1,573.6 | 1,758.0 | 1,601.1 | 1,931.7 | 2,091.5 | 2,264.6 | 2,452.1 | 2,655.0 |
| Inventories, % | 8.22 | 8.16 | 7.53 | 7.49 | 6.87 | 7.65 | 7.65 | 7.65 | 7.65 | 7.65 |
| Accounts Payable | 2,735.5 | 2,513.9 | 2,755.6 | 3,434.2 | 3,250.5 | 3,576.8 | 3,872.8 | 4,193.3 | 4,540.4 | 4,916.2 |
| Accounts Payable, % | 16.05 | 13.05 | 13.19 | 14.63 | 13.95 | 14.17 | 14.17 | 14.17 | 14.17 | 14.17 |
| Capital Expenditure | -452.3 | -585.1 | -638.2 | -626.5 | -558.7 | -697.1 | -754.8 | -817.3 | -884.9 | -958.2 |
| Capital Expenditure, % | -2.65 | -3.04 | -3.05 | -2.67 | -2.4 | -2.76 | -2.76 | -2.76 | -2.76 | -2.76 |
| Tax Rate, % | 35.29 | 35.29 | 35.29 | 35.29 | 35.29 | 35.29 | 35.29 | 35.29 | 35.29 | 35.29 |
| EBITAT | 192.9 | 419.8 | 365.8 | 730.1 | 541.4 | 517.8 | 560.7 | 607.1 | 657.4 | 711.8 |
| Depreciation | ||||||||||
| Changes in Account Receivables | ||||||||||
| Changes in Inventories | ||||||||||
| Changes in Accounts Payable | ||||||||||
| Capital Expenditure | ||||||||||
| UFCF | -1,654.3 | 243.9 | 133.7 | 971.0 | 668.5 | -48.5 | 369.6 | 400.2 | 433.4 | 469.2 |
| WACC, % | 6.94 | 7.14 | 7.11 | 7.23 | 7.17 | 7.12 | 7.12 | 7.12 | 7.12 | 7.12 |
| PV UFCF | ||||||||||
| SUM PV UFCF | 1,264.3 | |||||||||
| Long Term Growth Rate, % | 3.00 | |||||||||
| Free cash flow (T + 1) | 483 | |||||||||
| Terminal Value | 11,733 | |||||||||
| Present Terminal Value | 8,319 | |||||||||
| Enterprise Value | 9,583 | |||||||||
| Net Debt | 2,444 | |||||||||
| Equity Value | 7,139 | |||||||||
| Diluted Shares Outstanding, MM | 56 | |||||||||
| Equity Value Per Share | 126.40 |
What You Will Get
- Real LEA Financial Data: Pre-filled with Lear Corporation’s historical and projected data for precise analysis.
- Fully Editable Template: Modify key inputs like revenue growth, WACC, and EBITDA % with ease.
- Automatic Calculations: See Lear Corporation’s intrinsic value update instantly based on your changes.
- Professional Valuation Tool: Designed for investors, analysts, and consultants seeking accurate DCF results.
- User-Friendly Design: Simple structure and clear instructions for all experience levels.
Key Features
- 🔍 Real-Life LEA Financials: Pre-filled historical and projected data for Lear Corporation (LEA).
- ✏️ Fully Customizable Inputs: Adjust all critical parameters (yellow cells) like WACC, growth %, and tax rates.
- 📊 Professional DCF Valuation: Built-in formulas calculate Lear’s intrinsic value using the Discounted Cash Flow method.
- ⚡ Instant Results: Visualize Lear’s valuation instantly after making changes.
- Scenario Analysis: Test and compare outcomes for various financial assumptions side-by-side.
How It Works
- 1. Access the Template: Download and open the Excel file featuring Lear Corporation’s (LEA) preloaded data.
- 2. Modify Assumptions: Adjust essential inputs such as growth rates, WACC, and capital expenditures.
- 3. View Results Instantly: The DCF model automatically calculates the intrinsic value and NPV.
- 4. Explore Scenarios: Evaluate various forecasts to assess different valuation outcomes.
- 5. Use with Assurance: Present expert valuation insights to bolster your decision-making process.
Why Choose This Calculator for Lear Corporation (LEA)?
- User-Friendly Interface: Perfectly crafted for both novices and seasoned professionals.
- Customizable Inputs: Effortlessly adjust parameters to suit your financial analysis.
- Real-Time Feedback: Observe immediate updates to Lear Corporation’s valuation as you modify inputs.
- Pre-Configured Data: Comes equipped with Lear Corporation’s actual financial metrics for swift evaluation.
- Preferred by Experts: Favored by investors and analysts for making well-informed choices.
Who Should Use This Product?
- Investors: Evaluate Lear Corporation’s (LEA) valuation prior to making investment decisions.
- CFOs and Financial Analysts: Optimize valuation methodologies and assess financial forecasts.
- Startup Founders: Discover how established firms like Lear Corporation (LEA) are appraised in the market.
- Consultants: Provide expert valuation analyses and reports for your clients.
- Students and Educators: Utilize current data to learn and teach valuation strategies effectively.
What the Template Contains
- Pre-Filled Data: Contains Lear Corporation’s historical financials and projections.
- Discounted Cash Flow Model: Editable DCF valuation model with automatic calculations.
- Weighted Average Cost of Capital (WACC): A dedicated sheet for calculating WACC based on custom inputs.
- Key Financial Ratios: Evaluate Lear Corporation’s profitability, efficiency, and leverage.
- Customizable Inputs: Easily edit revenue growth, margins, and tax rates.
- Clear Dashboard: Visuals and tables summarizing key valuation outcomes.
Disclaimer
All information, articles, and product details provided on this website are for general informational and educational purposes only. We do not claim any ownership over, nor do we intend to infringe upon, any trademarks, copyrights, logos, brand names, or other intellectual property mentioned or depicted on this site. Such intellectual property remains the property of its respective owners, and any references here are made solely for identification or informational purposes, without implying any affiliation, endorsement, or partnership.
We make no representations or warranties, express or implied, regarding the accuracy, completeness, or suitability of any content or products presented. Nothing on this website should be construed as legal, tax, investment, financial, medical, or other professional advice. In addition, no part of this site—including articles or product references—constitutes a solicitation, recommendation, endorsement, advertisement, or offer to buy or sell any securities, franchises, or other financial instruments, particularly in jurisdictions where such activity would be unlawful.
All content is of a general nature and may not address the specific circumstances of any individual or entity. It is not a substitute for professional advice or services. Any actions you take based on the information provided here are strictly at your own risk. You accept full responsibility for any decisions or outcomes arising from your use of this website and agree to release us from any liability in connection with your use of, or reliance upon, the content or products found herein.