
|
Levi Strauss & Co. (LEVI): VRIO Analysis [Mar-2026 Updated] |
Fully Editable: Tailor To Your Needs In Excel Or Sheets
Professional Design: Trusted, Industry-Standard Templates
Investor-Approved Valuation Models
MAC/PC Compatible, Fully Unlocked
No Expertise Is Needed; Easy To Follow
Levi Strauss & Co. (LEVI) Bundle
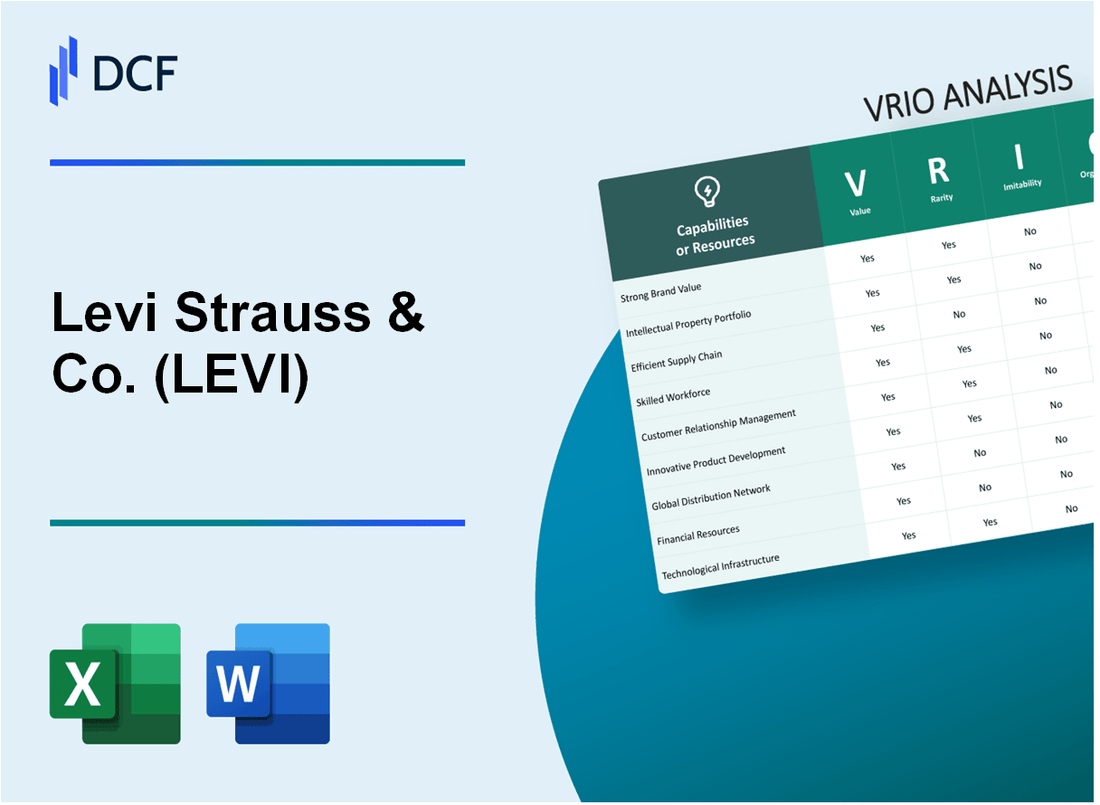
Unlocking the secrets to Levi Strauss & Co. (LEVI)'s long-term success hinges on a rigorous look at its core assets. This VRIO analysis strips away the noise to reveal whether the company's resources are truly Valuable, Rare, Inimitable, and Organized to capture a sustainable competitive advantage. Discover the strategic foundation - or the critical gaps - defining Levi Strauss & Co. (LEVI)'s market power in the analysis below.
Levi Strauss & Co. (LEVI) - VRIO Analysis: Iconic Levi's Brand Equity
You’re looking at the core engine of Levi Strauss & Co.’s valuation, and frankly, it’s the one asset that keeps the whole operation running smoothly. The brand equity isn't just a nice-to-have; it’s the moat protecting their margins, even when the macro environment gets choppy.
Value: It commands premium pricing and drives customer loyalty
The brand’s value is evident in its pricing power and the resulting financial uplift. For the first quarter of fiscal year 2025, the Levi's® brand delivered a solid 8% global growth on an organic basis, contributing to the company's total reported net revenues of $1.5 billion for the quarter. This strength allows Levi Strauss & Co. to maintain premium positioning against fast-fashion competitors, which directly supports their improved profitability, like the reported operating margin of 12.5% in Q1 2025. That loyalty means customers choose Levi's® first when they need a new pair of jeans.
Here’s a quick look at the Q1 2025 performance metrics tied to this brand strength:
- Levi's® Global Organic Growth: 8%
- Total Q1 2025 Net Revenues: $1.5 billion
- Q1 2025 Operating Margin: 12.5%
Rarity: While many apparel brands exist, the sheer, enduring cultural relevance of the core Levi's name is rare globally
Honestly, in the crowded apparel space, true, multi-generational cultural icons are few and far between. Many brands have fleeting relevance based on a single trend or a specific celebrity endorsement. Levi's®, however, has transcended being just clothing; it’s a piece of Americana and a global symbol of durability and authenticity. That deep, cross-demographic, cross-border resonance is extremely rare. Few competitors can claim the same immediate recognition and cultural weight across every major market.
Imitability: The history and cultural embedding are nearly impossible to replicate quickly; it takes generations
You can copy the stitching, you can even copy the red tab design, but you cannot buy 150 years of cultural embedding. Imitating the history and the near-mythic status of the original blue jean is the ultimate barrier. It’s not a patent you can reverse-engineer or a technology you can license. This is what we call a 'path-dependent' resource; it was built over decades of real-world adoption, from gold miners to rock stars. What this estimate hides is the difficulty in manufacturing the story that consumers buy into.
Organization: The company keeps the brand "firmly at the center of culture" via marketing and collaborations
Levi Strauss & Co. is defintely organized to exploit this asset. CEO Michelle Gass explicitly stated in Q1 2025 earnings calls that the company will continue to fuel momentum by keeping the brand firmly at the center of culture across the globe. This isn't just talk; it's backed by strategic investment in Direct-to-Consumer (DTC) channels, which grew 12% organically in Q1 2025, ensuring they control the customer experience and brand messaging. They are structuring the business around the brand's strength.
Competitive Advantage: Sustained
Because the brand equity is valuable, rare, and costly (if not impossible) to imitate, and the company is actively organizing around it, this resource provides Levi Strauss & Co. with a sustained competitive advantage. It’s the bedrock of their long-term pricing power and market position.
Here is the summary of the VRIO assessment for this core brand asset:
| VRIO Dimension | Assessment/Evidence (2025 Data) | Implication |
| Value (V) | Drives 8% organic growth for the Levi's® brand in Q1 2025. | Yes, enables premium pricing and strong revenue. |
| Rarity (R) | Enduring, multi-generational cultural relevance is globally unique among apparel. | Yes, few competitors share this level of embedded status. |
| Inimitability (I) | Built over 150+ years of history; cannot be replicated by competitors quickly. | Yes, it is socially complex and path-dependent. |
| Organization (O) | Company strategy explicitly centers the brand via DTC focus (12% organic growth in Q1 2025). | Yes, systems support the brand's exploitation. |
| Competitive Advantage | Sustained | The brand equity is the primary source of long-term outperformance. |
Finance: draft the impact of the 8% Q1 brand growth on the full-year margin forecast by Tuesday.
Levi Strauss & Co. (LEVI) - VRIO Analysis: Direct-to-Consumer (DTC) Channel Execution
Value: DTC is the profit engine, with net revenues up 11% in Q3 2025 (reported basis) and 9% (organic basis), making up 46% of total net revenue that quarter. Gross margin expanded 110 basis points to 61.7% in Q3 2025. Operating margin reached 10.8% in Q3 2025, up from 2.3% in Q3 2024. Net income from continuing operations was $122 million in Q3 2025, compared to $23 million in Q3 2024.
The DTC channel delivered high-single-digit comparable sales growth. E-commerce net revenues grew 18% on a reported basis and 16% on an organic basis in Q3 2025.
| Metric (Q3 2025) | Direct-to-Consumer (DTC) | Wholesale | Total Net Revenues |
|---|---|---|---|
| Net Revenue Growth (Reported) | 11% | 3% | 7% |
| Net Revenue Growth (Organic) | 9% | 5% | 7% |
| Share of Total Net Revenue | 46% | Implied 54% | 100% |
Rarity: Achieving over 46% of total revenue through the DTC channel while sustaining high-single-digit comparable sales growth is rare in legacy apparel. The pivot is described as driving a 'meaningful inflection' in financial performance.
Organic DTC growth drivers in Q3 2025 included:
- U.S. increase of 7%.
- Europe increase of 4%.
- Asia increase of 14%.
Imitability: Competitors can open stores, but replicating the operational expertise and customer data moat is hard. The company raised its full-year fiscal 2025 reported net revenue growth outlook to approximately 3%, up from 1% to 2%.
Organization: The entire pivot is centered on this strategy, showing strong organizational alignment under CEO Michelle Gass, who stated confidence in delivering sustained, profitable growth into 2026 and beyond. The company returned approximately $151 million to shareholders in Q3 2025, a 118% increase year over year.
Competitive Advantage: Sustained.
Levi Strauss & Co. (LEVI) - VRIO Analysis: Product Portfolio Diversification
The analysis focuses on the strategic value derived from Levi Strauss & Co.'s efforts to diversify its product portfolio beyond its core men's jeans offering.
| VRIO Attribute | Assessment | Supporting Data/Evidence |
|---|---|---|
| Value | Reduces reliance on core men's jeans; growth in adjacent categories is evident. | DTC net revenues comprised 52% of total net revenues in Q1 FY25. Beyond Yoga net revenues in Q3 FY25 were $33 million. Gross margin in Q1 FY25 was 62.1%, up 330 basis points from Q1 FY24. |
| Rarity | Successfully scaling a secondary brand (Beyond Yoga) alongside core segment revitalization is uncommon. | Beyond Yoga net revenues increased 10% (reported/organic) in Q1 FY25. |
| Imitability | Product design and category expansion are imitable, but successful integration and brand equity transfer are difficult to replicate quickly. | Q1 FY25 Levi's® brand organic growth was up 8% globally. |
| Organization | Actively managed through focus on product pipeline and category expansion. | CEO noted intent to fuel momentum through a 'robust product pipeline' in Q1 FY25. Adjusted EBIT margin in Q1 FY25 reached 13.4%, up 400 basis points to PY. |
| Competitive Advantage | Temporary. | Competitors can pursue similar category expansion strategies. |
The diversification strategy is supported by tangible financial metrics demonstrating growth outside the traditional core.
- The Direct-to-Consumer (DTC) channel, a key component of the broader strategy, accounted for 52% of total net revenues in Q1 FY25.
- E-commerce net revenues grew 16% organically in Q3 FY25, comprising 46% of total net revenues for that quarter.
- The Beyond Yoga athleisure brand reported net revenues of $33 million in Q3 FY25, reflecting a 2.5% increase year-over-year.
- In Q1 FY25, the company achieved a gross margin of 62.1%, an increase of 330 basis points compared to Q1 FY24.
- The overall Levi's® brand saw organic growth of 8% globally in Q1 FY25.
Levi Strauss & Co. (LEVI) - VRIO Analysis: Agile and Evolving Global Supply Chain
Value
Allows the company to navigate tariffs and supply shocks, noted as an asset in an uncertain environment. The company is pursuing mitigation strategies and creating new efficiencies in its global supply chain amidst inflationary pressures and supply chain costs. The shift to a hybrid distribution and logistics model aims to reduce fulfillment costs per unit. Project Fuel, a multi-year global productivity initiative beginning in 2024, focuses on optimizing the operating model.
Rarity
An 'agile global supply chain' is common, but one actively restructuring its DC network to better serve DTC is less common. The DTC channel represents more than 40% of the U.S. market. The company began its strategic shift from a primarily owned-and-operated distribution logistics network to one including third-party logistics providers in the U.S. and Europe in 2024.
Imitability
The physical network is imitable, but the deep vendor relationships and operational knowledge are not. In fiscal year 2021, LS&Co. sourced apparel, accessories and footwear from more than 500 supplier facilities located in approximately 40 countries. As of 2024, LS&Co. engaged with over 510 Tier 1 facilities and more than 80 Tier 2 facilities.
| Metric | Value | Year/Context |
|---|---|---|
| Tier 1 Facilities Engaged | Over 510 | 2024 |
| Tier 2 Facilities Engaged | More than 80 | 2024 |
| Total Supplier Facilities Sourced From | More than 500 | 2021 |
| Sourcing Countries | Approximately 40 | 2021 |
Organization
The ongoing distribution center transition shows commitment. The company expects to ramp down parallel operation of owned and leased distribution centers by early 2026. This transition followed a 19.5% year-over-year jump in distribution costs in Q3 due to overlapping facilities.
- The goal of the transformation is to better serve direct-to-consumer channels.
- The company is moving toward a hybrid model utilizing a mix of owned and leased facilities operated by third-party logistics providers.
- The company anticipates distribution expenses and costs per unit will decrease as the new network is completed.
Competitive Advantage
Temporary.
Levi Strauss & Co. (LEVI) - VRIO Analysis: Strong Profitability and Margin Structure
Value: High gross margins, reaching 61.7% in Q3 2025, directly fund growth and shareholder returns, supporting the raised full-year outlook. Full-year guidance raised for organic net revenue growth to approximately 6% and adjusted diluted EPS to $1.27 to $1.32. Shareholder returns in Q3 2025 totaled approximately $151 million, a 118% increase over the prior year.
| Metric | Q3 2025 | Q3 2024 |
| Gross Margin | 61.7% | 60.6% |
| Operating Margin | 10.8% | 2.3% |
| DTC Share of Net Revenues | 46% | N/A |
| Adjusted Diluted EPS | $0.34 | $0.33 |
Rarity: Achieving a record gross margin of 61.7% in Q3 2025 in a challenging macro environment is rare; this is driven by a favorable channel mix, with Direct-to-Consumer (DTC) comprising 46% of total net revenues. The gross margin expansion of 110 basis points offset an 80 basis points tariff headwind.
Imitability: Competitors can raise prices, but achieving this margin level requires the DTC mix, which saw reported net revenue growth of 11% in Q3 2025, and disciplined cost control, evidenced by the full-year gross margin expansion guidance increasing to 100 basis points.
Organization: The focus on profitability across the organization is clearly paying off in the numbers, reflected by the Operating Margin increasing to 10.8% in Q3 2025 from 2.3% in Q3 2024.
- DTC net revenues increased 11% on a reported basis in Q3 2025.
- E-commerce net revenues grew 18% on a reported basis in Q3 2025.
- The company raised its full-year adjusted diluted EPS outlook to $1.27 to $1.32.
Competitive Advantage: Sustained.
Levi Strauss & Co. (LEVI) - VRIO Analysis: Global Market Penetration and Footprint
Value
Revenue from outside the U.S. is almost 60% of total revenue. The Trailing Twelve Months (TTM) revenue ending August 31, 2025, was $6.589B. The company reported net revenues of $1.5 billion for Q3 FY25.
Regional performance in Q3 FY25:
| Region | Reported Net Revenue Growth | Organic Net Revenue Growth |
|---|---|---|
| Asia | 12% | 12% |
| Americas | 6% | 7% |
| Europe | 5% | 3% |
Direct-to-Consumer (DTC) comprised 46% of total net revenues in Q3.
Rarity
The company's international business grew 9% in Q3 FY25. The global footprint includes products sold in approximately 50,000 retail locations worldwide as of fiscal year 2024.
Imitability
Building the global network took decades. The company expanded its global store fleet, highlighted by openings in London and Paris as of fiscal year 2024.
Organization
- The company raised its full-year fiscal 2025 reported net revenue growth outlook to approximately 3%.
- Asia showed strong acceleration with 12% reported and organic growth in Q3 FY25.
- The company is managing diverse regional growth effectively, with international business up 9% in Q3 FY25.
Competitive Advantage
Sustained.
Levi Strauss & Co. (LEVI) - VRIO Analysis: Organizational Agility and Transformation Focus
Organizational Agility and Transformation Focus
Value: The ability to execute a major strategic pivot - from wholesale-led to DTC-first - while raising guidance is a key asset. This agility is evidenced by consistent channel performance inflection.
| Metric (Q3 FY2025) | DTC (Direct-to-Consumer) | Wholesale | Total Net Revenue |
|---|---|---|---|
| Reported Net Revenue Growth (YoY) | +11% | +3% | +7% |
| Organic Net Revenue Growth (YoY) | +9% | +5% | N/A |
| % of Total Net Revenues | 46% | 54% (Implied) | 100% |
The company raised its full-year reported net revenue growth outlook to approximately 3%, up from the prior outlook of 1% to 2%, following four consecutive quarters of high-single-digit growth.
Rarity: Many companies plan transformation; few deliver it while maintaining growth and raising outlooks. The sustained positive momentum across channels, especially the DTC channel, is rare in a complex macro environment.
- In Q2 FY2025, DTC net revenues increased 11% reported, with DTC comprising 50% of total net revenues.
- The Levi's brand revenue grew 9% globally on an organic basis in Q2 FY2025.
- The company delivered positive global comps for the 14th straight time in Q3 FY2025.
Imitability: This is rooted in leadership and culture, which is hard for others to copy. The commitment to structural change, including portfolio streamlining, is a cultural manifestation.
- The company completed the sale of the Dockers intellectual property and operations in the US and Canada for gross proceeds of $194.7 million on July 31.
- The strategic focus is on the core Levi's brand, with Dockers now classified as discontinued operations.
- The company is fundamentally transforming to a 'head-to-toe denim lifestyle retailer'.
Organization: The successful execution of the DTC strategy and Project Fuel demonstrates high organizational capability. Project Fuel is a key initiative for operational efficiency.
- Project FUEL, a two-year productivity initiative, was expected to generate net cost savings of $100 million in fiscal 2024.
- Gross margin in Q4 2024 reached a company record of 61.3%, driven in part by savings from Project Fuel initiatives.
- The company reduced its SKUs by close to 15%, with impact beginning in the first half of the following year.
- The corporate workforce reduction targeted 10 percent to 15 percent over six months as part of Project FUEL.
- Restructuring charges related to Project Fuel were estimated between $110 million to $120 million in Q1 2024.
Competitive Advantage: Sustained.
Levi Strauss & Co. (LEVI) - VRIO Analysis: Active Intellectual Property (IP) Management
Active Intellectual Property (IP) Management
Value: The recent definitive agreement to sell the Dockers brand to Authentic Brands Group has an initial transaction value of $311 million, with a potential total value reaching up to $391 million based on an $80 million earnout opportunity. This demonstrates the ability to realize significant capital from non-core assets.
Rarity: The successful execution of a multi-stage divestiture for a legacy brand, achieving an initial valuation exceeding $300 million, suggests a sophisticated approach to portfolio optimization and asset monetization.
Imitability: The specific valuation achieved is tied to Levi Strauss & Co.'s internal strategic assessment and the unique market positioning of Dockers under Authentic Brands Group's ownership model. The transaction is structured in two stages, with the U.S. and Canada IP and operations expected to close around July 31, 2025, and the remaining global operations by January 31, 2026.
Organization: The company intends to return approximately $100 million of the net cash proceeds from the transaction to shareholders through share repurchases, aligning with its established capital allocation strategy.
Competitive Advantage: Temporary.
Financial details related to the Dockers divestiture:
| Metric | Amount/Detail |
|---|---|
| Initial Transaction Value (Total) | $311 million |
| Performance Earnout Potential | $80 million |
| Maximum Potential Transaction Value | Up to $391 million |
| Dockers 2024 Revenue | More than $323 million |
| Dockers Share of LEVI 2024 Revenue | Roughly 5% |
| LEVI 2024 Net Revenues | $6.4 billion |
| Planned Shareholder Return from Proceeds | Approximately $100 million |
The strategic priorities driving the sale include:
- Focusing on a direct-to-consumer (DTC) first approach.
- Growing international presence.
- Investing in opportunities across women's and denim lifestyle categories.
- Scaling the Beyond Yoga brand.
Levi Strauss & Co. (LEVI) - VRIO Analysis: Culture of 'Profits Through Principles'
Value: Drives ESG initiatives (like the 2030 Water Strategy) which appeal to modern consumers and investors, supporting brand perception and long-term risk mitigation.
Rarity: Integrating strong social responsibility goals (like net-zero by 2050) with a profit mandate is a difficult balance.
Imitability: Values are deeply cultural; they are not something you can buy or easily code into a business.
Organization: Recognized in Fortune's Most Admired Companies, suggesting external validation of their operational ethics.
Competitive Advantage: Sustained.
The culture of 'Profits Through Principles' is evidenced by concrete, measurable commitments and external validation:
- Goal to achieve net-zero greenhouse gas emissions across the value chain by no later than 2050.
- Pledge to use 100% renewable electricity across all company-operated facilities by 2025.
- New water stewardship goal: 15% absolute reduction in freshwater use across garment manufacturing supply chain by 2030 (against a 2022 baseline).
- Goal to recycle and reuse 40% of water consumed during manufacturing by 2030.
- At the end of 2024, key wet finishing suppliers in water-stressed regions had reduced freshwater usage by 27% since 2018, saving over 7 billion liters cumulatively.
External validation of operational ethics and performance includes recognition in Fortune's World's Most Admired Companies list, ranking second among the top five apparel companies globally in the 2025 publication.
The financial strategy incorporates portfolio realignment, exemplified by the Dockers sale, to focus on core brands and DTC growth. The following table summarizes key financial and operational metrics:
| Metric Category | Financial/Statistical Number | Context/Year |
|---|---|---|
| Full Year Net Revenues | $6.4 billion | Fiscal Year 2024 |
| Q4 Net Revenues | $1.8 billion | Q4 2024 |
| Q4 Gross Margin | 61.3% | Q4 2024 Record High |
| Adjusted Free Cash Flow | $671 million | Fiscal Year 2024 Record |
| Capital Returned to Shareholders | $289 million | Fiscal Year 2024 |
| Dockers Sale Initial Value | $311 million | Transaction Value |
| Dockers Sale Potential Value | Up to $391 million | Including Earnout |
| Dockers Sale Proceeds Allocation | Approx. $100 million | Intended for Share Repurchases |
| Dockers Brand 2024 Revenue | $323.2 million | Annual Revenue |
Regarding the Q4 2025 cash flow projection incorporating the Dockers sale proceeds: The initial closing for U.S. and Canadian operations is expected around July 31, 2025. The latest reported cash and cash equivalents were $690 million, with total liquidity of approximately $1.5 billion as of the end of Q4 2024. The net cash proceeds intended for share repurchases are approximately $100 million.
Disclaimer
All information, articles, and product details provided on this website are for general informational and educational purposes only. We do not claim any ownership over, nor do we intend to infringe upon, any trademarks, copyrights, logos, brand names, or other intellectual property mentioned or depicted on this site. Such intellectual property remains the property of its respective owners, and any references here are made solely for identification or informational purposes, without implying any affiliation, endorsement, or partnership.
We make no representations or warranties, express or implied, regarding the accuracy, completeness, or suitability of any content or products presented. Nothing on this website should be construed as legal, tax, investment, financial, medical, or other professional advice. In addition, no part of this site—including articles or product references—constitutes a solicitation, recommendation, endorsement, advertisement, or offer to buy or sell any securities, franchises, or other financial instruments, particularly in jurisdictions where such activity would be unlawful.
All content is of a general nature and may not address the specific circumstances of any individual or entity. It is not a substitute for professional advice or services. Any actions you take based on the information provided here are strictly at your own risk. You accept full responsibility for any decisions or outcomes arising from your use of this website and agree to release us from any liability in connection with your use of, or reliance upon, the content or products found herein.