
|
Life Insurance Corporation of India (LICI.NS) DCF Valuation |
Fully Editable: Tailor To Your Needs In Excel Or Sheets
Professional Design: Trusted, Industry-Standard Templates
Investor-Approved Valuation Models
MAC/PC Compatible, Fully Unlocked
No Expertise Is Needed; Easy To Follow
Life Insurance Corporation of India (LICI.NS) Bundle
Discover the true potential of Life Insurance Corporation of India (LICINS) with our advanced DCF Calculator! Adjust critical assumptions, explore various scenarios, and evaluate how different changes affect the valuation of LICINS – all within a convenient Excel template.
What You Will Receive
- Customizable Excel Template: A fully adjustable Excel-based DCF Calculator featuring pre-filled financial data for LICINS (Life Insurance Corporation of India).
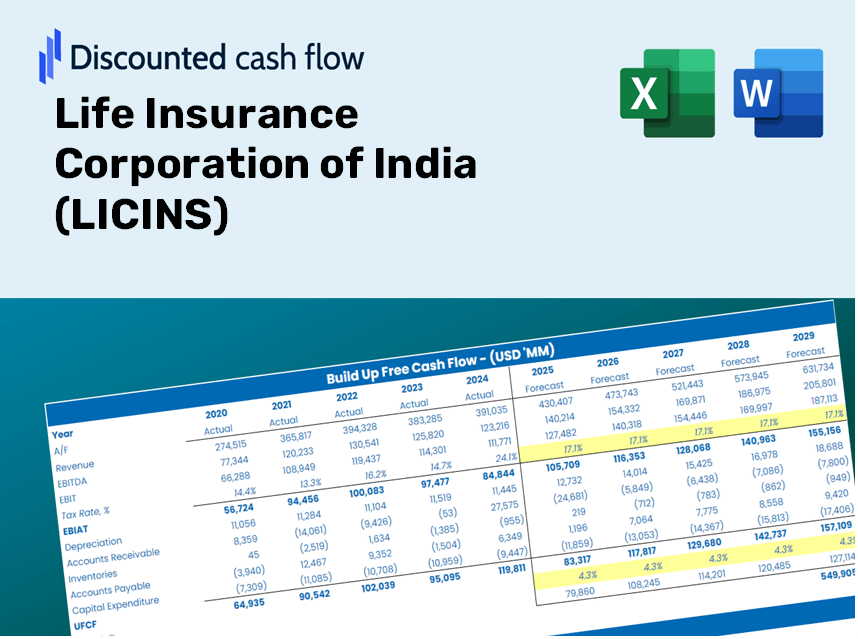
- Current Market Data: Access to historical figures and future projections (highlighted in the yellow cells).
- Flexible Forecasting: Modify assumptions such as premium growth, claims ratio, and discount rate.
- Instant Calculations: Quickly observe how your inputs affect LICINS's valuation.
- Professional Resource: Designed for investors, CFOs, consultants, and finance professionals.
- User-Centric Layout: Organized for ease of navigation and clarity, complete with step-by-step guidance.
Key Features
- 🔍 Real-Life LICINS Financials: Pre-filled historical and projected data for Life Insurance Corporation of India (LICINS).
- ✏️ Fully Customizable Inputs: Modify all essential parameters (yellow cells) such as WACC, growth %, and tax rates.
- 📊 Professional DCF Valuation: Integrated formulas compute the intrinsic value of LICINS using the Discounted Cash Flow method.
- ⚡ Instant Results: Visualize the valuation of LICINS immediately after adjusting inputs.
- Scenario Analysis: Evaluate and compare different outcomes based on various financial assumptions side-by-side.
How It Functions
- Download the Template: Gain immediate access to the Excel-based LICINS DCF Calculator.
- Input Your Assumptions: Modify the yellow-highlighted cells for growth rates, WACC, profit margins, and more.
- Instant Calculations: The model dynamically updates the intrinsic value of Life Insurance Corporation of India (LICINS).
- Test Scenarios: Experiment with various assumptions to assess potential changes in valuation.
- Analyze and Decide: Utilize the results to inform your investment or financial strategy.
Why Choose the LICINS Calculator?
- User-Friendly Interface: Tailored for both novices and seasoned professionals.
- Customizable Inputs: Effortlessly adjust parameters to suit your analytical needs.
- Real-Time Results: Witness immediate updates to LICINS's valuation as you tweak the inputs.
- Pre-Loaded Data: Comes with LICINS's actual financial information for swift assessments.
- Preferred by Experts: Reliably utilized by investors and analysts for making sound decisions.
Who Should Utilize This Product?
- Investors: Accurately assess the fair value of Life Insurance Corporation of India (LICINS) before making investment choices.
- CFOs: Utilize a high-quality DCF model for financial reporting and analysis specific to LICINS.
- Consultants: Easily customize the template for valuation reports tailored to clients interested in LICINS.
- Entrepreneurs: Acquire knowledge about financial modeling practices employed by leading insurance companies.
- Educators: Implement it as a resource for teaching valuation techniques in finance courses.
Contents of the Template
- Pre-Filled Data: Contains LICINS's historical financials and projected forecasts.
- Discounted Cash Flow Model: Editable DCF valuation model with automated calculations.
- Weighted Average Cost of Capital (WACC): A specific sheet for calculating WACC using customized inputs.
- Key Financial Ratios: Evaluate LICINS's profitability, efficiency, and financial leverage.
- Customizable Inputs: Easily modify revenue growth rates, margins, and tax rates.
- Clear Dashboard: Visual summaries of key valuation results through charts and tables.
Disclaimer
All information, articles, and product details provided on this website are for general informational and educational purposes only. We do not claim any ownership over, nor do we intend to infringe upon, any trademarks, copyrights, logos, brand names, or other intellectual property mentioned or depicted on this site. Such intellectual property remains the property of its respective owners, and any references here are made solely for identification or informational purposes, without implying any affiliation, endorsement, or partnership.
We make no representations or warranties, express or implied, regarding the accuracy, completeness, or suitability of any content or products presented. Nothing on this website should be construed as legal, tax, investment, financial, medical, or other professional advice. In addition, no part of this site—including articles or product references—constitutes a solicitation, recommendation, endorsement, advertisement, or offer to buy or sell any securities, franchises, or other financial instruments, particularly in jurisdictions where such activity would be unlawful.
All content is of a general nature and may not address the specific circumstances of any individual or entity. It is not a substitute for professional advice or services. Any actions you take based on the information provided here are strictly at your own risk. You accept full responsibility for any decisions or outcomes arising from your use of this website and agree to release us from any liability in connection with your use of, or reliance upon, the content or products found herein.