
|
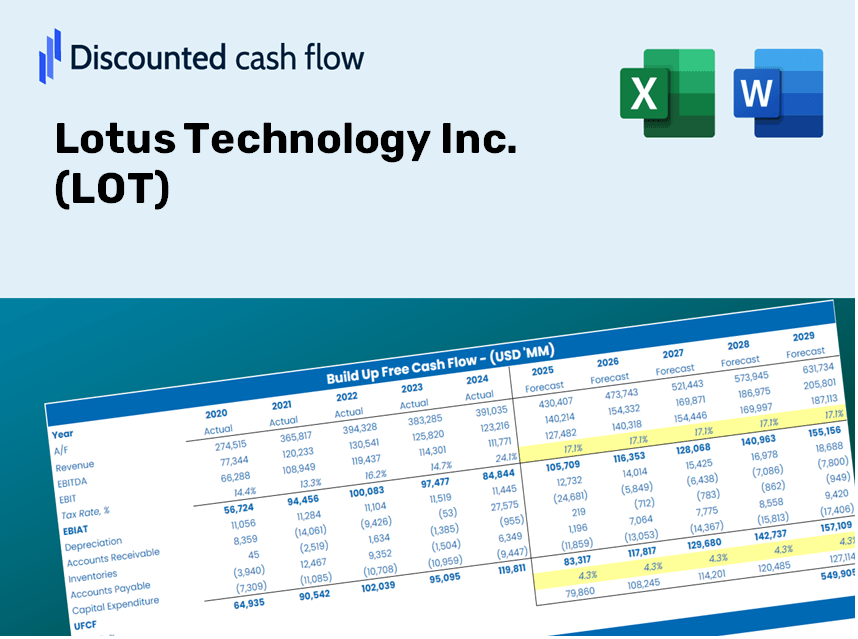
Lotus Technology Inc. (LOT) DCF Valuation |
Fully Editable: Tailor To Your Needs In Excel Or Sheets
Professional Design: Trusted, Industry-Standard Templates
Investor-Approved Valuation Models
MAC/PC Compatible, Fully Unlocked
No Expertise Is Needed; Easy To Follow
Lotus Technology Inc. American Depositary Shares (LOT) Bundle
Explore the financial prospects of Lotus Technology Inc. (LOT) with our user-friendly DCF Calculator! Simply enter your assumptions for growth, margins, and costs to calculate the intrinsic value of Lotus Technology Inc. (LOT) and enhance your investment strategy.
Benefits You Will Receive
- Customizable Excel Template: An adaptable Excel-based DCF Calculator featuring pre-filled real LOT financials.
- Accurate Historical Data: Access to past data and forward-looking projections (highlighted in the yellow cells).
- Flexible Forecasting: Adjust forecast variables such as revenue growth, EBITDA percentage, and WACC.
- Instant Calculations: Quickly view the effects of your inputs on Lotus Technology’s valuation.
- Professional Resource: Designed for investors, CFOs, consultants, and financial analysts.
- Intuitive Layout: Organized for clarity and simplicity, complete with step-by-step guidance.
Key Features
- Pre-Loaded Data: Comprehensive historical financial statements and pre-filled projections for Lotus Technology Inc. (LOT).
- Fully Customizable Inputs: Adjust WACC, tax rates, revenue growth, and EBITDA margins as needed.
- Real-Time Results: Instantly view recalculated intrinsic value for Lotus Technology Inc. (LOT).
- Enhanced Visual Outputs: Interactive dashboard charts showcase valuation outcomes and essential metrics.
- Designed for Precision: A professional-grade tool tailored for analysts, investors, and finance professionals.
How It Functions
- Download the Template: Gain immediate access to the Excel-based LOT DCF Calculator.
- Input Your Assumptions: Modify the yellow-highlighted cells for growth rates, WACC, profit margins, and more.
- Instant Calculations: The model automatically recalculates the intrinsic value of Lotus Technology Inc. (LOT).
- Test Scenarios: Experiment with various assumptions to assess potential changes in valuation.
- Analyze and Decide: Leverage the results to inform your investment or financial analysis.
Why Choose This Calculator for Lotus Technology Inc. (LOT)?
- Accurate Data: Utilize genuine Lotus Technology Inc. financials for dependable valuation outcomes.
- Customizable: Tailor essential factors such as growth rates, WACC, and tax rates to align with your forecasts.
- Time-Saving: Preconfigured calculations streamline your process, saving you the effort of starting from scratch.
- Professional-Grade Tool: Crafted for investors, analysts, and consultants focused on Lotus Technology Inc. (LOT).
- User-Friendly: An intuitive interface and guided instructions make it accessible for all users.
Who Can Benefit from This Product?
- Professional Investors: Develop comprehensive and accurate valuation models for portfolio assessments of Lotus Technology Inc. (LOT).
- Corporate Finance Teams: Evaluate valuation scenarios to inform strategic decision-making within the organization.
- Consultants and Advisors: Deliver precise valuation insights for clients interested in Lotus Technology Inc. (LOT) stock.
- Students and Educators: Utilize real-world data for hands-on practice and instruction in financial modeling.
- Tech Enthusiasts: Explore the valuation methods applied to tech companies like Lotus Technology Inc. (LOT) in the market.
Contents of the Template
- Preloaded LOT Data: Comprehensive historical and forecasted financial metrics, such as revenue, EBIT, and capital expenditures.
- DCF and WACC Models: Advanced spreadsheets for determining intrinsic value and calculating Weighted Average Cost of Capital.
- Editable Inputs: Cells highlighted in yellow for modifying revenue growth, tax rates, and discount rates.
- Financial Statements: Detailed annual and quarterly financials to facilitate in-depth analysis.
- Key Ratios: Metrics on profitability, leverage, and efficiency for performance evaluation.
- Dashboard and Charts: Visual representations of valuation results and underlying assumptions.
Disclaimer
All information, articles, and product details provided on this website are for general informational and educational purposes only. We do not claim any ownership over, nor do we intend to infringe upon, any trademarks, copyrights, logos, brand names, or other intellectual property mentioned or depicted on this site. Such intellectual property remains the property of its respective owners, and any references here are made solely for identification or informational purposes, without implying any affiliation, endorsement, or partnership.
We make no representations or warranties, express or implied, regarding the accuracy, completeness, or suitability of any content or products presented. Nothing on this website should be construed as legal, tax, investment, financial, medical, or other professional advice. In addition, no part of this site—including articles or product references—constitutes a solicitation, recommendation, endorsement, advertisement, or offer to buy or sell any securities, franchises, or other financial instruments, particularly in jurisdictions where such activity would be unlawful.
All content is of a general nature and may not address the specific circumstances of any individual or entity. It is not a substitute for professional advice or services. Any actions you take based on the information provided here are strictly at your own risk. You accept full responsibility for any decisions or outcomes arising from your use of this website and agree to release us from any liability in connection with your use of, or reliance upon, the content or products found herein.