
|
Lotus Bakeries NV (LOTB.BR) DCF Valuation |
Fully Editable: Tailor To Your Needs In Excel Or Sheets
Professional Design: Trusted, Industry-Standard Templates
Investor-Approved Valuation Models
MAC/PC Compatible, Fully Unlocked
No Expertise Is Needed; Easy To Follow
Lotus Bakeries NV (LOTB.BR) Bundle
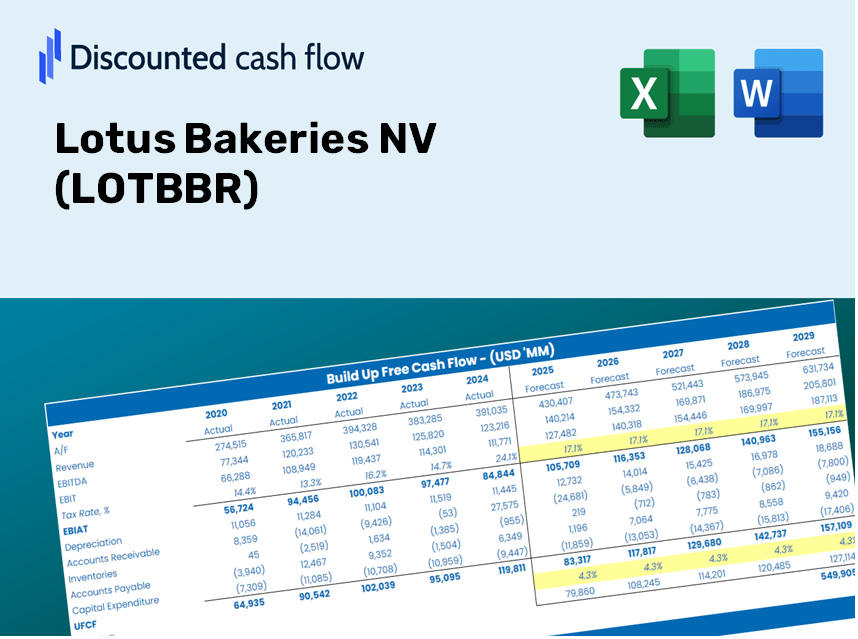
Simplify Lotus Bakeries NV (LOTBBR) valuation with this customizable DCF Calculator! Featuring real Lotus Bakeries NV (LOTBBR) financials and adjustable forecast inputs, you can test scenarios and uncover Lotus Bakeries NV (LOTBBR) fair value in minutes.
What You Will Receive
- Authentic Lotus Data: Preloaded financial information – including revenue and EBIT – derived from real and forecasted figures.
- Complete Customization: Modify all essential parameters (yellow cells) such as WACC, growth %, and tax rates.
- Immediate Valuation Adjustments: Automatic recalculations to assess how changes affect Lotus Bakeries NV’s fair value.
- Flexible Excel Template: Designed for quick modifications, scenario analysis, and comprehensive projections.
- Efficient and Precise: Avoid starting from scratch while ensuring accuracy and adaptability.
Key Features
- Advanced DCF Calculator: Features comprehensive unlevered and levered DCF valuation models tailored for Lotus Bakeries NV (LOTBBR).
- WACC Calculator: Includes a pre-built Weighted Average Cost of Capital spreadsheet with customizable input fields.
- Editable Forecast Assumptions: Adjust growth rates, capital expenditures, and discount rates as needed.
- Integrated Financial Ratios: Evaluate profitability, leverage, and efficiency ratios specific to Lotus Bakeries NV (LOTBBR).
- Dashboard and Visualizations: Graphical representations provide a clear overview of key valuation metrics for straightforward analysis.
How It Works
- Download the Template: Gain immediate access to the Excel-based LOTBBR DCF Calculator.
- Input Your Assumptions: Modify the yellow-highlighted cells for growth rates, WACC, margins, and other parameters.
- Instant Calculations: The model automatically recalculates the intrinsic value of Lotus Bakeries NV.
- Test Scenarios: Experiment with various assumptions to see how valuations may change.
- Analyze and Decide: Utilize the results to inform your investment strategy or financial analysis.
Why Opt for the Lotus Bakeries NV (LOTBBR) Calculator?
- Time Efficiency: Skip the hassle of building a DCF model from the ground up – it’s ready to go.
- Enhanced Precision: Dependable financial data and formulas minimize valuation errors.
- Completely Customizable: Adjust the model to align with your specific assumptions and forecasts.
- Intuitive Insights: User-friendly charts and outputs simplify the analysis of results.
- Endorsed by Professionals: Crafted for experts who prioritize accuracy and ease of use.
Who Can Benefit from This Product?
- Professional Investors: Develop comprehensive and dependable valuation models for in-depth portfolio analysis.
- Corporate Finance Teams: Examine valuation scenarios to inform and enhance internal strategies.
- Consultants and Advisors: Deliver clients precise valuation insights for Lotus Bakeries NV (LOTBBR) stock.
- Students and Educators: Utilize real-world data to enhance skills in financial modeling and teaching.
- Food Industry Enthusiasts: Gain insights into how companies like Lotus Bakeries NV (LOTBBR) are evaluated in the market.
What the Template Includes
- Pre-Filled DCF Model: Lotus Bakeries NV’s (LOTBBR) financial data preloaded for immediate application.
- WACC Calculator: Comprehensive calculations for Weighted Average Cost of Capital.
- Financial Ratios: Assess Lotus Bakeries NV’s (LOTBBR) profitability, leverage, and operational efficiency.
- Editable Inputs: Modify assumptions such as growth rates, profit margins, and CAPEX to align with your scenarios.
- Financial Statements: Access annual and quarterly reports to facilitate thorough analysis.
- Interactive Dashboard: Visually represent key valuation metrics and outcomes effortlessly.
Disclaimer
All information, articles, and product details provided on this website are for general informational and educational purposes only. We do not claim any ownership over, nor do we intend to infringe upon, any trademarks, copyrights, logos, brand names, or other intellectual property mentioned or depicted on this site. Such intellectual property remains the property of its respective owners, and any references here are made solely for identification or informational purposes, without implying any affiliation, endorsement, or partnership.
We make no representations or warranties, express or implied, regarding the accuracy, completeness, or suitability of any content or products presented. Nothing on this website should be construed as legal, tax, investment, financial, medical, or other professional advice. In addition, no part of this site—including articles or product references—constitutes a solicitation, recommendation, endorsement, advertisement, or offer to buy or sell any securities, franchises, or other financial instruments, particularly in jurisdictions where such activity would be unlawful.
All content is of a general nature and may not address the specific circumstances of any individual or entity. It is not a substitute for professional advice or services. Any actions you take based on the information provided here are strictly at your own risk. You accept full responsibility for any decisions or outcomes arising from your use of this website and agree to release us from any liability in connection with your use of, or reliance upon, the content or products found herein.