
|
Larsen & Toubro Limited (LT.NS): BCG Matrix |
Fully Editable: Tailor To Your Needs In Excel Or Sheets
Professional Design: Trusted, Industry-Standard Templates
Investor-Approved Valuation Models
MAC/PC Compatible, Fully Unlocked
No Expertise Is Needed; Easy To Follow
Larsen & Toubro Limited (LT.NS) Bundle
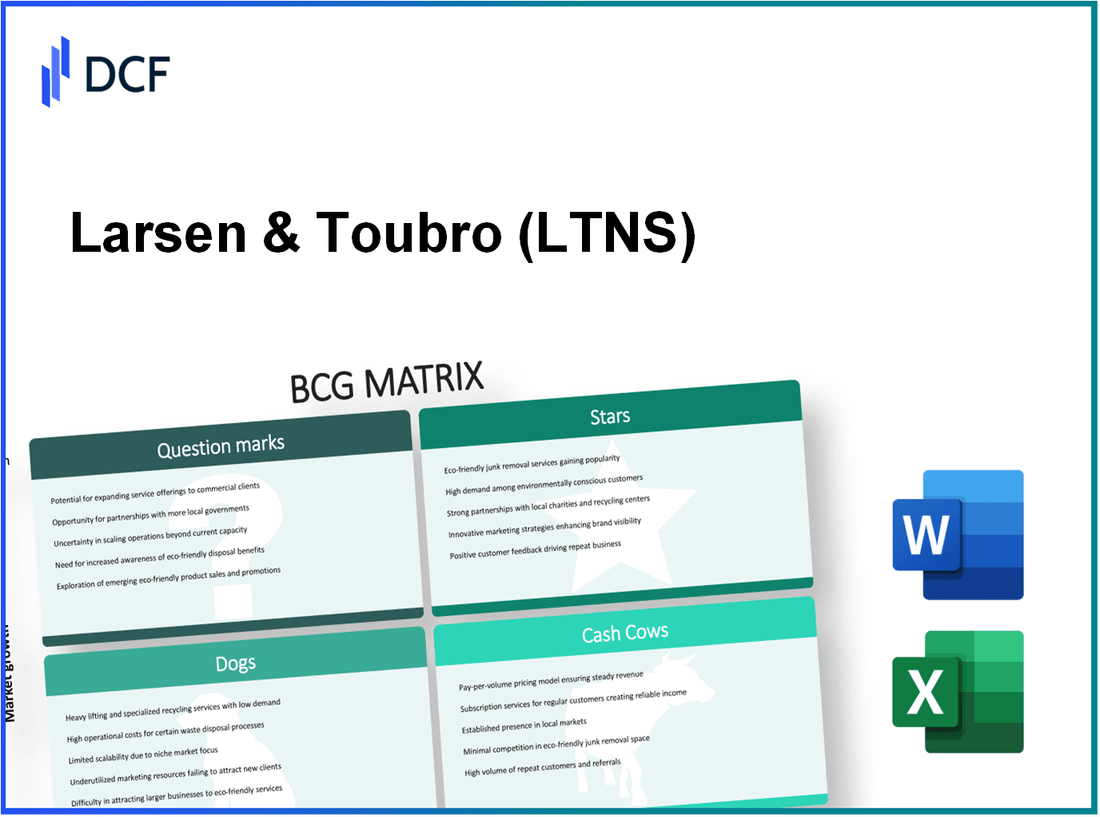
The Boston Consulting Group Matrix is a powerful tool that helps businesses like Larsen & Toubro Limited assess their various segments based on market growth and share. By categorizing operations into Stars, Cash Cows, Dogs, and Question Marks, we can unpack where the company excels and where it may need to pivot. Curious about how L&T aligns with this matrix? Let’s dive deeper into each category and explore the potential and challenges within its diverse portfolio.
Background of Larsen & Toubro Limited
Larsen & Toubro Limited (L&T) is an Indian multinational conglomerate with a focus on engineering, construction, manufacturing, and technology. Founded in 1938 by Henning Holck-Larsen and Soren Kristian Toubro, the company has grown to become one of India's largest and most respected firms. Headquartered in Mumbai, L&T operates across multiple segments, including infrastructure, power, heavy engineering, and information technology.
As of FY 2022, L&T's consolidated revenue stood at approximately ₹1.5 trillion, showcasing significant growth driven by major projects in various sectors. The company is also recognized for its robust presence in international markets, with operations in over 30 countries.
The construction and engineering division, which constitutes a large portion of L&T's business, is responsible for landmark projects across India and abroad. Notable projects include the Mumbai International Airport and the Dhanbad-Patna Rail Link. Additionally, L&T’s technology services segment has seen substantial growth, contributing to its innovation and operational efficiency.
In the fiscal year 2022-2023, L&T reported a net profit of approximately ₹90 billion, reflecting a healthy profit margin of about 6%. The company has strategically positioned itself to capitalize on the growing demand for infrastructure development in India, particularly given the government's focus on economic growth through enhanced connectivity and urbanization.
Furthermore, L&T has been proactive in adopting sustainable practices, with investments in renewable energy and green technology. This commitment is evident in its efforts to reduce carbon emissions and align with the global focus on sustainability, making it a frontrunner in responsible business practices.
With a diversified portfolio and a strong order book of over ₹3 trillion as of mid 2023, L&T is well-equipped to navigate the challenges of the market while continuing to deliver value to its stakeholders.
Larsen & Toubro Limited - BCG Matrix: Stars
Infrastructure Projects in India
Larsen & Toubro (L&T) is a dominant player in the Indian infrastructure sector. As of FY2023, the company's order book stood at approximately ₹3.75 trillion (around $45 billion), with a substantial portion derived from infrastructure projects.
In 2022, L&T was awarded significant contracts, including:
- High-speed rail projects worth ₹300 billion
- Metro projects in major cities like Mumbai and Delhi, cumulatively valued over ₹120 billion
- Highway construction contracts amounting to ₹150 billion
These ongoing projects highlight L&T’s stronghold in a high-growth market, propelled by government initiatives aiming to boost infrastructure spending, which is projected to reach approximately ₹100 trillion by 2025 under the National Infrastructure Pipeline (NIP).
Hydrocarbon Engineering Services
The Hydrocarbon division of L&T has emerged as a Star with a robust presence in both domestic and international markets. In FY2023, this segment contributed approximately ₹400 billion in revenue.
Key projects include:
- The development of the mega refinery project in Maharashtra, with an investment exceeding ₹1.5 trillion
- Multiple offshore platform constructions, with contracts valued at around ₹100 billion
- Gas processing units that represent a total order intake of ₹200 billion
With the global energy market witnessing a shift towards sustainable solutions, L&T stands at the forefront, making substantial capital investments to expand its hydrocarbon portfolio.
IT and Technology Services
L&T’s IT and technology services segment has shown impressive growth, with a market share of approximately 8% in the Indian IT services market, which is poised to grow at a CAGR of about 10% over the next five years.
In FY2023, revenue from this segment reached about ₹300 billion, reflecting an annual growth of 15%.
Key offerings include:
- Smart city solutions, contributing around ₹50 billion
- Digital transformation services, generating ₹100 billion
- Cybersecurity services with a projected growth rate of 20% annually
Investment in R&D for emerging technologies like AI and IoT is projected to increase to ₹20 billion annually as L&T aims to maintain its Star status in this dynamic market.
| Segment | Revenue FY2023 (₹ Billion) | Growth Rate | Market Share |
|---|---|---|---|
| Infrastructure Projects | Varied from ongoing contracts totaling approx. 300-1200 billion | ~10% | Market Leader |
| Hydrocarbon Engineering Services | 400 | ~15% | High |
| IT and Technology Services | 300 | ~15% | 8% |
With strategic investments and a strong market position, L&T continues to solidify its status as a leader in these high-growth segments, positioning itself well for future transitions into Cash Cows as market growth stabilizes.
Larsen & Toubro Limited - BCG Matrix: Cash Cows
Larsen & Toubro Limited (L&T) operates in diverse sectors, with significant cash cows in various domains. These segments generate robust cash flow, supporting the overall financial health of the company.
Heavy Electrical Equipment Manufacturing
The heavy electrical equipment manufacturing segment has consistently showcased a high market share. In FY 2022, L&T's electrical & automation division reported revenues of approximately ₹12,000 crores. This segment benefits from strong demand in power generation and transmission, backed by an increasing focus on renewable energy sources.
| Year | Revenue (₹ Crores) | Market Share (%) | Operating Margin (%) |
|---|---|---|---|
| 2020 | 10,200 | 15 | 9.5 |
| 2021 | 11,500 | 16 | 10.2 |
| 2022 | 12,000 | 17 | 10.5 |
With a focus on efficiency, the company aims to enhance production capabilities while maintaining lower investment levels in marketing. The profitability metrics indicate a steady growth trajectory, but with limited expansion opportunities due to market maturity.
Construction Services
L&T's construction services division is another prime cash cow, commanding a significant share of the market. As of FY 2022, this division contributed approximately ₹1,60,000 crores to the company's overall revenue, representing a market share of around 20% in the Indian construction sector.
| Year | Revenue (₹ Crores) | Market Share (%) | Operating Margin (%) |
|---|---|---|---|
| 2020 | 1,41,000 | 19 | 10.0 |
| 2021 | 1,50,000 | 19.5 | 9.8 |
| 2022 | 1,60,000 | 20 | 10.2 |
This division has been driving consistent revenue, as it benefits from government-led infrastructure initiatives. Maintaining a strong order book and optimizing operational efficiency are pivotal in sustaining cash flows.
Financial Services
L&T's financial services sector also plays a critical role as a cash cow. The financial services segment posted a revenue of about ₹9,000 crores in FY 2022, with a market share of approximately 5% in the overall financial services market.
| Year | Revenue (₹ Crores) | Market Share (%) | Return on Equity (%) |
|---|---|---|---|
| 2020 | 7,500 | 4.5 | 12.0 |
| 2021 | 8,200 | 4.8 | 12.5 |
| 2022 | 9,000 | 5 | 13.0 |
The financial services sector contributes significantly by generating steady cash flow while maintaining a conservative risk profile. As market conditions evolve, L&T strategically invests revenues back into the segment to support growth and maintain competitive advantages.
Larsen & Toubro Limited - BCG Matrix: Dogs
Within Larsen & Toubro Limited (L&T), certain business segments characterize the 'Dogs' category of the BCG matrix, reflecting low growth and low market share. These segments often require careful consideration for restructuring, divestment, or strategic refocus.
Shipbuilding
The shipbuilding segment of L&T has faced significant challenges, with declining revenues in recent years. As of FY2023, L&T's shipbuilding division reported revenues of approximately ₹1,200 crores, reflecting a 5% decline from the previous fiscal year. The global shipbuilding industry has been hampered by overcapacity and fierce competition, resulting in limited opportunities for growth. Consequently, L&T's market share in this sector remains below 5%, necessitating a reevaluation of its long-term strategy.
Textiles
The textile division, while historically a significant player, continues to struggle in a market that offers minimal growth prospects. L&T's textile operations generated revenues of around ₹800 crores in FY2023, a drop of 10% compared to the previous year. The increasing competition from unorganized players, along with shifts in consumer preferences toward synthetic and sustainable fabrics, has adversely affected L&T's market penetration, which stands at less than 3%.
Heavy Machinery Exports
Heavy machinery exports have also contributed to the 'Dogs' category, with L&T experiencing stagnant growth in this area. In FY2023, the export segment generated revenue of approximately ₹1,000 crores, representing a 2% growth from FY2022, which is considered inadequate given the global demand for heavy machinery. The market share in this segment remains around 6%. Factors influencing this stagnation include fluctuating global commodity prices and geopolitical tensions affecting export markets.
| Business Segment | FY2023 Revenue (in ₹ crores) | Growth Rate (%) | Market Share (%) |
|---|---|---|---|
| Shipbuilding | 1,200 | -5 | 5 |
| Textiles | 800 | -10 | 3 |
| Heavy Machinery Exports | 1,000 | 2 | 6 |
These segments of L&T are currently categorized as 'Dogs' due to their combination of low growth and low market share. As the company evaluates its portfolio, these units highlight the need for strategic divestiture or reevaluation to mitigate financial entrapment in low-performing assets.
Larsen & Toubro Limited - BCG Matrix: Question Marks
Larsen & Toubro Limited (L&T) operates in multiple sectors, and within the BCG Matrix framework, several of its initiatives are classified as Question Marks. These segments present high growth possibilities but exhibit low market share, necessitating strategic investment to enhance their performance. Below are key areas categorized as Question Marks.
Renewable Energy Solutions
The renewable energy sector is experiencing rapid expansion, making it a significant focus for L&T. The global renewable energy market size was valued at approximately $881 billion in 2020 and is projected to grow at a compound annual growth rate (CAGR) of 8.4% from 2021 to 2028. In India, the renewable energy capacity reached around 150 GW by March 2023.
L&T has invested heavily in solar and wind energy projects, with the company reporting a revenue of approximately ₹27,000 crore ($3.6 billion) in 2022 from its Power segment, which includes renewable sources. However, its market share in the overall renewable energy sector remains relatively low at about 6%. The company needs to amplify its market presence to capitalize on this rapidly growing sector.
Smart City Projects
The smart cities initiative in India has gained significant traction, with the Smart Cities Mission launched in 2015 aimed at developing 100 cities across the country. The estimated investment in smart city projects is anticipated to be around $30 billion by 2025. L&T has been active in this arena, securing various contracts for urban infrastructure development.
As of 2023, L&T's participation in smart city projects has generated revenues of approximately ₹10,000 crore ($1.3 billion). However, the company currently holds a market share of just 5% in the smart city infrastructure segment. With India’s urbanization rate projected to reach 60% by 2031, L&T has the potential to enhance its share significantly through strategic investments and partnerships.
International Infrastructure Development
L&T has been involved in various international infrastructure projects, focusing primarily on markets in the Middle East, Africa, and Southeast Asia. The global infrastructure market is expected to grow from approximately $4 trillion in 2021 to around $5.5 trillion by 2030, indicating a robust growth rate driven by urbanization and economic development.
Despite the growth prospects, L&T’s share in the international infrastructure domain remains limited, with an estimated market share of around 4%. The company has reported project wins totaling approximately ₹15,000 crore ($2 billion) in international contracts in the last fiscal year. However, to transition from a Question Mark to a Star, L&T will need to leverage its existing capabilities and enhance its global footprint significantly.
| Segment | Market Size (2023) | L&T Revenue (2022) | Market Share (%) | Growth Rate (CAGR) |
|---|---|---|---|---|
| Renewable Energy Solutions | $881 billion | ₹27,000 crore ($3.6 billion) | 6% | 8.4% |
| Smart City Projects | $30 billion | ₹10,000 crore ($1.3 billion) | 5% | - |
| International Infrastructure Development | $4 trillion | ₹15,000 crore ($2 billion) | 4% | - |
In summary, L&T’s Question Mark segments—Renewable Energy Solutions, Smart City Projects, and International Infrastructure Development—present a mix of opportunities and challenges. The potential for growth remains substantial, but strategic investments and market penetration are essential for transforming these initiatives into viable Stars within the BCG Matrix framework.
The BCG Matrix for Larsen & Toubro Limited paints a vivid picture of its diverse business landscape, showcasing its growth potential and strategic positioning. From its robust Stars like infrastructure projects and IT services to the Cash Cows that consistently fuel revenue, the company is well-positioned. Meanwhile, the presence of Dogs highlights areas in need of reevaluation, while the Question Marks suggest promising avenues for future investment. Analyzing these categories allows investors and stakeholders to grasp the company's dynamics in a competitive market, emphasizing strategic decisions that could drive success.
[right_small]Disclaimer
All information, articles, and product details provided on this website are for general informational and educational purposes only. We do not claim any ownership over, nor do we intend to infringe upon, any trademarks, copyrights, logos, brand names, or other intellectual property mentioned or depicted on this site. Such intellectual property remains the property of its respective owners, and any references here are made solely for identification or informational purposes, without implying any affiliation, endorsement, or partnership.
We make no representations or warranties, express or implied, regarding the accuracy, completeness, or suitability of any content or products presented. Nothing on this website should be construed as legal, tax, investment, financial, medical, or other professional advice. In addition, no part of this site—including articles or product references—constitutes a solicitation, recommendation, endorsement, advertisement, or offer to buy or sell any securities, franchises, or other financial instruments, particularly in jurisdictions where such activity would be unlawful.
All content is of a general nature and may not address the specific circumstances of any individual or entity. It is not a substitute for professional advice or services. Any actions you take based on the information provided here are strictly at your own risk. You accept full responsibility for any decisions or outcomes arising from your use of this website and agree to release us from any liability in connection with your use of, or reliance upon, the content or products found herein.