
|
Lupin Limited (LUPIN.NS) DCF Valuation |
Fully Editable: Tailor To Your Needs In Excel Or Sheets
Professional Design: Trusted, Industry-Standard Templates
Investor-Approved Valuation Models
MAC/PC Compatible, Fully Unlocked
No Expertise Is Needed; Easy To Follow
Lupin Limited (LUPIN.NS) Bundle
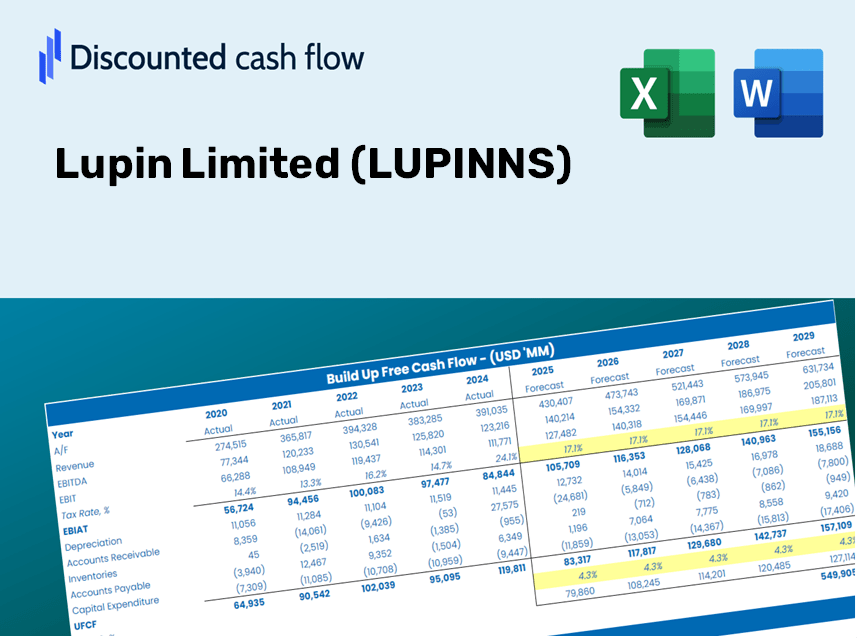
Streamline your analysis and improve precision with our (LUPINNS) DCF Calculator! Equipped with actual data from Lupin Limited and customizable assumptions, this tool enables you to forecast, evaluate, and assess the value of Lupin Limited like a seasoned investor.
Discounted Cash Flow (DCF) - (USD MM)
| Year | AY1 2021 |
AY2 2022 |
AY3 2023 |
AY4 2024 |
AY5 2025 |
FY1 2026 |
FY2 2027 |
FY3 2028 |
FY4 2029 |
FY5 2030 |
|---|---|---|---|---|---|---|---|---|---|---|
| Revenue | 150,249.5 | 163,209.8 | 164,917.8 | 196,563.4 | 221,921.1 | 245,090.5 | 270,679.0 | 298,938.9 | 330,149.3 | 364,618.2 |
| Revenue Growth, % | 0 | 8.63 | 1.05 | 19.19 | 12.9 | 10.44 | 10.44 | 10.44 | 10.44 | 10.44 |
| EBITDA | 26,476.5 | -4,385.4 | 18,050.5 | 36,969.4 | 54,791.3 | 34,007.4 | 37,557.9 | 41,479.1 | 45,809.7 | 50,592.4 |
| EBITDA, % | 17.62 | -2.69 | 10.95 | 18.81 | 24.69 | 13.88 | 13.88 | 13.88 | 13.88 | 13.88 |
| Depreciation | 8,534.2 | 8,185.0 | 8,413.1 | 9,955.6 | 11,692.6 | 12,808.5 | 14,145.7 | 15,622.6 | 17,253.6 | 19,055.0 |
| Depreciation, % | 5.68 | 5.02 | 5.1 | 5.06 | 5.27 | 5.23 | 5.23 | 5.23 | 5.23 | 5.23 |
| EBIT | 17,942.3 | -12,570.4 | 9,637.4 | 27,013.8 | 43,098.7 | 21,199.0 | 23,412.2 | 25,856.6 | 28,556.1 | 31,537.5 |
| EBIT, % | 11.94 | -7.7 | 5.84 | 13.74 | 19.42 | 8.65 | 8.65 | 8.65 | 8.65 | 8.65 |
| Total Cash | 41,114.2 | 21,042.5 | 19,521.0 | 21,785.4 | 42,014.4 | 40,248.3 | 44,450.3 | 49,091.1 | 54,216.4 | 59,876.8 |
| Total Cash, percent | .0 | .0 | .0 | .0 | .0 | .0 | .0 | .0 | .0 | .0 |
| Account Receivables | 53,777.5 | 1,858.7 | 56,546.7 | 58,787.8 | 55,021.2 | 61,723.5 | 68,167.6 | 75,284.6 | 83,144.6 | 91,825.3 |
| Account Receivables, % | 35.79 | 1.14 | 34.29 | 29.91 | 24.79 | 25.18 | 25.18 | 25.18 | 25.18 | 25.18 |
| Inventories | 40,920.1 | 46,307.3 | 44,917.6 | 49,539.0 | 54,763.5 | 65,058.6 | 71,851.0 | 79,352.5 | 87,637.2 | 96,786.9 |
| Inventories, % | 27.23 | 28.37 | 27.24 | 25.2 | 24.68 | 26.54 | 26.54 | 26.54 | 26.54 | 26.54 |
| Accounts Payable | 20,144.4 | 22,829.1 | 25,315.3 | 29,581.1 | 29,581.6 | 34,863.7 | 38,503.6 | 42,523.5 | 46,963.1 | 51,866.3 |
| Accounts Payable, % | 13.41 | 13.99 | 15.35 | 15.05 | 13.33 | 14.22 | 14.22 | 14.22 | 14.22 | 14.22 |
| Capital Expenditure | -6,776.2 | -9,050.8 | -14,996.2 | -9,289.0 | -16,824.3 | -15,418.9 | -17,028.7 | -18,806.6 | -20,770.0 | -22,938.5 |
| Capital Expenditure, % | -4.51 | -5.55 | -9.09 | -4.73 | -7.58 | -6.29 | -6.29 | -6.29 | -6.29 | -6.29 |
| Tax Rate, % | 18.27 | 18.27 | 18.27 | 18.27 | 18.27 | 18.27 | 18.27 | 18.27 | 18.27 | 18.27 |
| EBITAT | 13,020.0 | -13,997.9 | 5,784.9 | 21,350.8 | 35,226.3 | 16,677.8 | 18,419.0 | 20,342.0 | 22,465.8 | 24,811.3 |
| Depreciation | ||||||||||
| Changes in Account Receivables | ||||||||||
| Changes in Inventories | ||||||||||
| Changes in Accounts Payable | ||||||||||
| Capital Expenditure | ||||||||||
| UFCF | -59,775.2 | 34,352.6 | -51,610.3 | 19,420.7 | 28,637.2 | 2,352.0 | 5,939.4 | 6,559.5 | 7,244.3 | 8,000.6 |
| WACC, % | 5.07 | 5.16 | 5.04 | 5.1 | 5.1 | 5.09 | 5.09 | 5.09 | 5.09 | 5.09 |
| PV UFCF | ||||||||||
| SUM PV UFCF | 25,445.9 | |||||||||
| Long Term Growth Rate, % | 4.00 | |||||||||
| Free cash flow (T + 1) | 8,321 | |||||||||
| Terminal Value | 760,520 | |||||||||
| Present Terminal Value | 593,225 | |||||||||
| Enterprise Value | 618,671 | |||||||||
| Net Debt | 39,041 | |||||||||
| Equity Value | 579,630 | |||||||||
| Diluted Shares Outstanding, MM | 458 | |||||||||
| Equity Value Per Share | 1,266.82 |
What You Will Receive
- Authentic LUPIN Financial Data: Pre-loaded with Lupin Limited’s historical and projected metrics for accurate analysis.
- Completely Customizable Template: Easily adjust key inputs such as revenue growth, WACC, and EBITDA percentage.
- Instant Calculations: Watch as Lupin’s intrinsic value recalibrates in real-time as you make adjustments.
- Professional Valuation Tool: Crafted for investors, analysts, and consultants aiming for reliable DCF outcomes.
- Intuitive Design: Streamlined layout and straightforward instructions suitable for users of all skill levels.
Key Features
- 🔍 Real-Life LUPIN Financials: Pre-filled historical and projected data for Lupin Limited.
- ✏️ Fully Customizable Inputs: Modify all essential parameters (yellow cells) such as WACC, growth %, and tax rates.
- 📊 Professional DCF Valuation: Built-in formulas to compute Lupin’s intrinsic value using the Discounted Cash Flow methodology.
- ⚡ Instant Results: Immediately visualize Lupin’s valuation after any adjustments.
- Scenario Analysis: Evaluate and compare results for different financial assumptions side-by-side.
How It Works
- Step 1: Download the Excel file.
- Step 2: Review the pre-populated data for Lupin Limited (LUPINNS), including historical and projected figures.
- Step 3: Modify the key assumptions (highlighted in yellow) based on your analysis.
- Step 4: Observe the automatic recalculations of Lupin Limited's (LUPINNS) intrinsic value.
- Step 5: Utilize the outputs for your investment decisions or reporting needs.
Why Choose This Calculator for Lupin Limited (LUPINNS)?
- User-Friendly Design: Perfectly suited for both novices and seasoned analysts.
- Customizable Inputs: Adjust parameters effortlessly to tailor your analysis.
- Real-Time Updates: Observe immediate changes in Lupin’s valuation as you modify inputs.
- Pre-Configured Data: Comes with Lupin’s actual financial information for swift evaluations.
- Relied Upon by Experts: Favored by investors and analysts for making strategic decisions.
Who Can Benefit from This Product?
- Professional Investors: Develop comprehensive and reliable valuation models for analyzing portfolios related to Lupin Limited (LUPINNS).
- Corporate Finance Teams: Evaluate valuation scenarios to inform strategic decisions within the organization.
- Consultants and Advisors: Offer clients precise valuation insights for Lupin Limited (LUPINNS) stock.
- Students and Educators: Utilize real-world data to enhance financial modeling skills and education.
- Pharmaceutical Enthusiasts: Gain insight into the market valuation of biopharmaceutical companies like Lupin Limited (LUPINNS).
Components of the Template
- Comprehensive DCF Model: An editable template featuring detailed valuation calculations.
- Real-World Data: Preloaded historical and projected financials for Lupin Limited (LUPINNS) to facilitate in-depth analysis.
- Customizable Parameters: Modify WACC, growth rates, and tax assumptions to explore various scenarios.
- Financial Statements: Complete annual and quarterly breakdowns for enhanced insights.
- Key Ratios: Integrated analysis covering profitability, efficiency, and leverage metrics.
- Dashboard with Visual Outputs: Visualizations including charts and tables providing clear, actionable insights.
Disclaimer
All information, articles, and product details provided on this website are for general informational and educational purposes only. We do not claim any ownership over, nor do we intend to infringe upon, any trademarks, copyrights, logos, brand names, or other intellectual property mentioned or depicted on this site. Such intellectual property remains the property of its respective owners, and any references here are made solely for identification or informational purposes, without implying any affiliation, endorsement, or partnership.
We make no representations or warranties, express or implied, regarding the accuracy, completeness, or suitability of any content or products presented. Nothing on this website should be construed as legal, tax, investment, financial, medical, or other professional advice. In addition, no part of this site—including articles or product references—constitutes a solicitation, recommendation, endorsement, advertisement, or offer to buy or sell any securities, franchises, or other financial instruments, particularly in jurisdictions where such activity would be unlawful.
All content is of a general nature and may not address the specific circumstances of any individual or entity. It is not a substitute for professional advice or services. Any actions you take based on the information provided here are strictly at your own risk. You accept full responsibility for any decisions or outcomes arising from your use of this website and agree to release us from any liability in connection with your use of, or reliance upon, the content or products found herein.