
|
The Law Debenture Corporation p.l.c. (LWDB.L) DCF Valuation |
Fully Editable: Tailor To Your Needs In Excel Or Sheets
Professional Design: Trusted, Industry-Standard Templates
Investor-Approved Valuation Models
MAC/PC Compatible, Fully Unlocked
No Expertise Is Needed; Easy To Follow
The Law Debenture Corporation p.l.c. (LWDB.L) Bundle
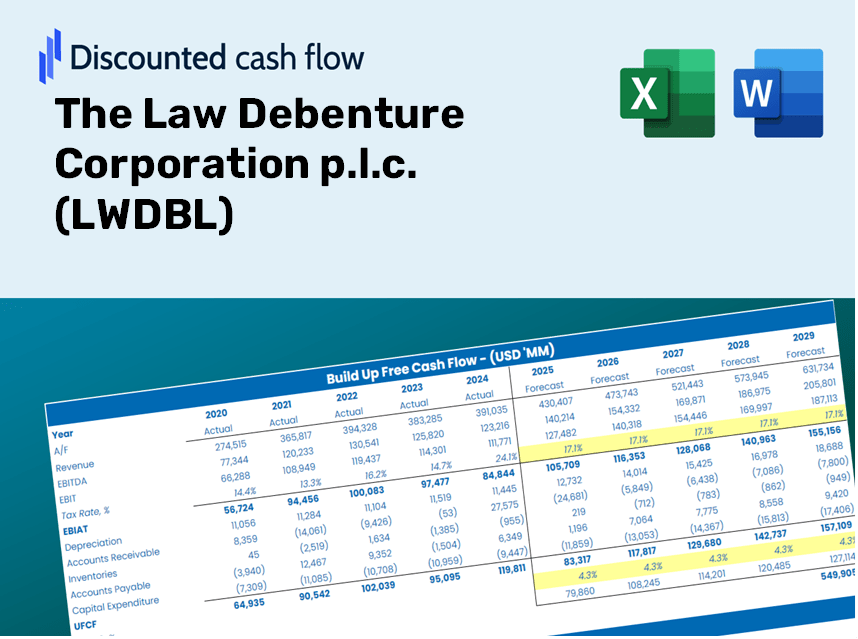
Discover the true value of The Law Debenture Corporation p.l.c. (LWDBL) with our advanced DCF Calculator! Adjust key assumptions, explore various scenarios, and evaluate how different changes affect The Law Debenture Corporation p.l.c. (LWDBL) valuation – all within a single Excel template.
Discounted Cash Flow (DCF) - (USD MM)
| Year | AY1 2020 |
AY2 2021 |
AY3 2022 |
AY4 2023 |
AY5 2024 |
FY1 2025 |
FY2 2026 |
FY3 2027 |
FY4 2028 |
FY5 2029 |
|---|---|---|---|---|---|---|---|---|---|---|
| Revenue | 67.8 | 196.9 | 108.2 | 133.4 | 168.4 | 212.3 | 267.8 | 337.7 | 425.9 | 537.1 |
| Revenue Growth, % | 0 | 190.45 | -45.06 | 23.29 | 26.24 | 26.12 | 26.12 | 26.12 | 26.12 | 26.12 |
| EBITDA | 10.7 | 157.2 | -76.2 | 86.1 | .0 | 38.1 | 48.1 | 60.7 | 76.5 | 96.5 |
| EBITDA, % | 15.78 | 79.84 | -70.41 | 64.59 | 0 | 17.96 | 17.96 | 17.96 | 17.96 | 17.96 |
| Depreciation | 1.3 | 1.6 | 1.9 | 2.2 | 2.3 | 3.2 | 4.0 | 5.1 | 6.4 | 8.0 |
| Depreciation, % | 1.88 | 0.79635 | 1.79 | 1.64 | 1.38 | 1.5 | 1.5 | 1.5 | 1.5 | 1.5 |
| EBIT | 9.4 | 155.6 | -78.1 | 84.0 | -2.3 | 35.0 | 44.1 | 55.6 | 70.1 | 88.4 |
| EBIT, % | 13.9 | 79.05 | -72.2 | 62.95 | -1.38 | 16.46 | 16.46 | 16.46 | 16.46 | 16.46 |
| Total Cash | 41.8 | 35.9 | 49.6 | 31.4 | 38.4 | 73.0 | 92.1 | 116.2 | 146.5 | 184.8 |
| Total Cash, percent | .0 | .0 | .0 | .0 | .0 | .0 | .0 | .0 | .0 | .0 |
| Account Receivables | 16.1 | 25.5 | 26.0 | 24.3 | 22.9 | 39.3 | 49.6 | 62.5 | 78.8 | 99.4 |
| Account Receivables, % | 23.79 | 12.95 | 24 | 18.22 | 13.59 | 18.51 | 18.51 | 18.51 | 18.51 | 18.51 |
| Inventories | .0 | .0 | -2.4 | .0 | .0 | -1.0 | -1.2 | -1.5 | -1.9 | -2.4 |
| Inventories, % | 0 | 0 | -2.25 | 0 | 0 | -0.44931 | -0.44931 | -0.44931 | -0.44931 | -0.44931 |
| Accounts Payable | 6.6 | 8.5 | 5.9 | 22.6 | 19.0 | 20.2 | 25.5 | 32.2 | 40.6 | 51.2 |
| Accounts Payable, % | 9.73 | 4.33 | 5.44 | 16.91 | 11.28 | 9.54 | 9.54 | 9.54 | 9.54 | 9.54 |
| Capital Expenditure | -1.7 | -1.1 | -1.2 | -.9 | -.5 | -2.2 | -2.7 | -3.5 | -4.4 | -5.5 |
| Capital Expenditure, % | -2.44 | -0.54597 | -1.13 | -0.69586 | -0.32254 | -1.03 | -1.03 | -1.03 | -1.03 | -1.03 |
| Tax Rate, % | 1.92 | 1.92 | 1.92 | 1.92 | 1.92 | 1.92 | 1.92 | 1.92 | 1.92 | 1.92 |
| EBITAT | 6.7 | 154.4 | -79.4 | 82.2 | -2.3 | 32.6 | 41.1 | 51.9 | 65.4 | 82.5 |
| Depreciation | ||||||||||
| Changes in Account Receivables | ||||||||||
| Changes in Inventories | ||||||||||
| Changes in Accounts Payable | ||||||||||
| Capital Expenditure | ||||||||||
| UFCF | -3.2 | 147.4 | -79.3 | 99.3 | -2.6 | 19.4 | 37.7 | 47.5 | 59.9 | 75.6 |
| WACC, % | 6.41 | 6.54 | 6.54 | 6.53 | 6.53 | 6.51 | 6.51 | 6.51 | 6.51 | 6.51 |
| PV UFCF | ||||||||||
| SUM PV UFCF | 192.5 | |||||||||
| Long Term Growth Rate, % | 2.00 | |||||||||
| Free cash flow (T + 1) | 77 | |||||||||
| Terminal Value | 1,709 | |||||||||
| Present Terminal Value | 1,247 | |||||||||
| Enterprise Value | 1,439 | |||||||||
| Net Debt | -38 | |||||||||
| Equity Value | 1,478 | |||||||||
| Diluted Shares Outstanding, MM | 131 | |||||||||
| Equity Value Per Share | 1,130.69 |
What You Will Receive
- Customizable Excel Template: A fully editable Excel-based DCF Calculator featuring pre-populated financial data for The Law Debenture Corporation p.l.c. (LWDBL).
- Actual Financial Data: Access to historical performance figures and forward-looking projections (highlighted in the yellow cells).
- Flexible Forecasting: Modify key assumptions such as revenue growth, EBITDA percentage, and WACC.
- Real-Time Calculations: Immediately observe how your inputs affect the valuation of The Law Debenture Corporation p.l.c. (LWDBL).
- Professional Resource: Designed for investors, CFOs, consultants, and financial analysts seeking detailed insights.
- Intuitive Interface: Organized for user-friendliness with clear guidance provided throughout the process.
Key Features
- Authentic Law Debenture Financials: Gain access to precise pre-loaded historical data and future forecasts for The Law Debenture Corporation p.l.c. (LWDBL).
- Tailorable Forecast Parameters: Modify the highlighted inputs such as discount rates, growth projections, and profit margins.
- Real-Time Calculations: Automatic updates for Discounted Cash Flow (DCF), Net Present Value (NPV), and comprehensive cash flow assessments.
- Interactive Dashboard: Intuitive charts and summaries designed to help you visualize your valuation findings effectively.
- Suitable for All Levels: A user-friendly layout crafted for investors, financial officers, and consultants alike.
How It Works
- Download: Obtain the pre-formatted Excel file featuring The Law Debenture Corporation p.l.c. (LWDBL) financial data.
- Customize: Modify projections, including revenue growth, EBITDA percentages, and WACC.
- Update Automatically: Real-time updates for intrinsic value and NPV calculations as you make changes.
- Test Scenarios: Generate various projections and quickly compare different outcomes.
- Make Decisions: Leverage the valuation findings to inform your investment strategy.
Why Choose The Law Debenture Corporation p.l.c. (LWDBL)?
- Reliability: Trustworthy performance backed by a solid track record.
- Adaptability: Tailored solutions that meet diverse client needs and preferences.
- Efficiency: Streamlined processes save you valuable time and resources.
- Expertise: Crafted with insight and knowledge from industry leaders.
- Accessibility: Intuitive services that cater to both seasoned investors and newcomers alike.
Who Can Benefit from This Product?
- Individual Investors: Gain insights to make well-informed choices about investing in The Law Debenture Corporation p.l.c. (LWDBL).
- Financial Analysts: Enhance valuation methodologies with ready-to-apply financial models tailored for LWDBL.
- Consultants: Provide clients with expert valuation analysis of LWDBL efficiently and accurately.
- Business Owners: Learn how companies like The Law Debenture Corporation p.l.c. (LWDBL) are valued to inform your own business strategies.
- Finance Students: Develop valuation skills through real-world applications and data related to LWDBL.
Contents of the Template
- Pre-Filled DCF Model: The Law Debenture Corporation p.l.c. (LWDBL) financial data preloaded for immediate analysis.
- WACC Calculator: Comprehensive calculations for the Weighted Average Cost of Capital.
- Financial Ratios: Assess LWDBL’s profitability, leverage, and operational efficiency.
- Editable Inputs: Modify assumptions such as growth rates, profit margins, and CAPEX to tailor to your scenarios.
- Financial Statements: Annual and quarterly reports to facilitate thorough analysis.
- Interactive Dashboard: Effortlessly visualize crucial valuation metrics and findings.
Disclaimer
All information, articles, and product details provided on this website are for general informational and educational purposes only. We do not claim any ownership over, nor do we intend to infringe upon, any trademarks, copyrights, logos, brand names, or other intellectual property mentioned or depicted on this site. Such intellectual property remains the property of its respective owners, and any references here are made solely for identification or informational purposes, without implying any affiliation, endorsement, or partnership.
We make no representations or warranties, express or implied, regarding the accuracy, completeness, or suitability of any content or products presented. Nothing on this website should be construed as legal, tax, investment, financial, medical, or other professional advice. In addition, no part of this site—including articles or product references—constitutes a solicitation, recommendation, endorsement, advertisement, or offer to buy or sell any securities, franchises, or other financial instruments, particularly in jurisdictions where such activity would be unlawful.
All content is of a general nature and may not address the specific circumstances of any individual or entity. It is not a substitute for professional advice or services. Any actions you take based on the information provided here are strictly at your own risk. You accept full responsibility for any decisions or outcomes arising from your use of this website and agree to release us from any liability in connection with your use of, or reliance upon, the content or products found herein.