
|
Live Nation Entertainment, Inc. (LYV): BCG Matrix [Dec-2025 Updated] |
Fully Editable: Tailor To Your Needs In Excel Or Sheets
Professional Design: Trusted, Industry-Standard Templates
Investor-Approved Valuation Models
MAC/PC Compatible, Fully Unlocked
No Expertise Is Needed; Easy To Follow
Live Nation Entertainment, Inc. (LYV) Bundle
You're looking for a clear, no-nonsense breakdown of Live Nation Entertainment, Inc.'s business segments as of 2025, mapped to the classic BCG Matrix. Here's the quick math on where their cash is flowing and where the future bets are. We'll show you how the 19% revenue surge in Concerts and the 71% margin in Sponsorship are fueling the high 30s AOI from the dominant Ticketing engine, while flagging the 9% dip in non-concert sales and the big $700 million to $800 million bets on new venues. Dive in to see exactly which parts of Live Nation Entertainment, Inc. are the Stars, the Cash Cows, the Dogs, and the high-stakes Question Marks right now.
Background of Live Nation Entertainment, Inc. (LYV)
Live Nation Entertainment, Inc. (LYV) stands as the world's premier live entertainment company, built upon three core global market leaders: Ticketmaster, Live Nation Concerts, and Live Nation Media & Sponsorship. As of late 2025, the company is demonstrating significant top-line momentum, reporting total revenue of $8.5 billion for the third quarter, marking an 11% increase year-over-year. This performance, while slightly below some analyst revenue expectations, underscores the sustained, strong consumer demand for live experiences globally.
The Concerts segment remains the largest revenue driver, posting Q3 revenue of $7.3 billion, which was up 11% compared to the prior year. A key indicator of future strength is the record stadium show count, which surged by 60% globally in Q3, signaling a major shift in scale for Live Nation Entertainment, Inc.'s (LYV) core promotion business. The company's CEO, Michael Rapino, has repeatedly pointed to this global expansion, particularly in international markets, as a central pillar for compounding growth over the next several years.
Ticketmaster, the ticketing arm, is showing impressive profitability gains, with its Adjusted Operating Income (AOI) jumping 21% in the third quarter. This was fueled by a 12% increase in fee-bearing Gross Transaction Value (GTV), even as the number of fee-bearing tickets sold only rose by 4% to 89 million in the quarter. Furthermore, the company is locking in future revenue, as evidenced by record Q3 deferred revenue figures: Event-Related Deferred Revenue hit $3.5 billion, up 37%, and Ticketmaster Deferred Revenue reached $231 million, up 30%.
The Media & Sponsorship segment also contributed robustly, with its AOI growing 14% year-over-year, supported by new strategic partnerships and a high operating margin of 71% in Q3. Overall, the company's Adjusted Operating Income (AOI) for the third quarter reached $1.03 billion, a 14% increase, which management is using to reiterate confidence in achieving double-digit AOI growth for the full year 2025 and beyond.
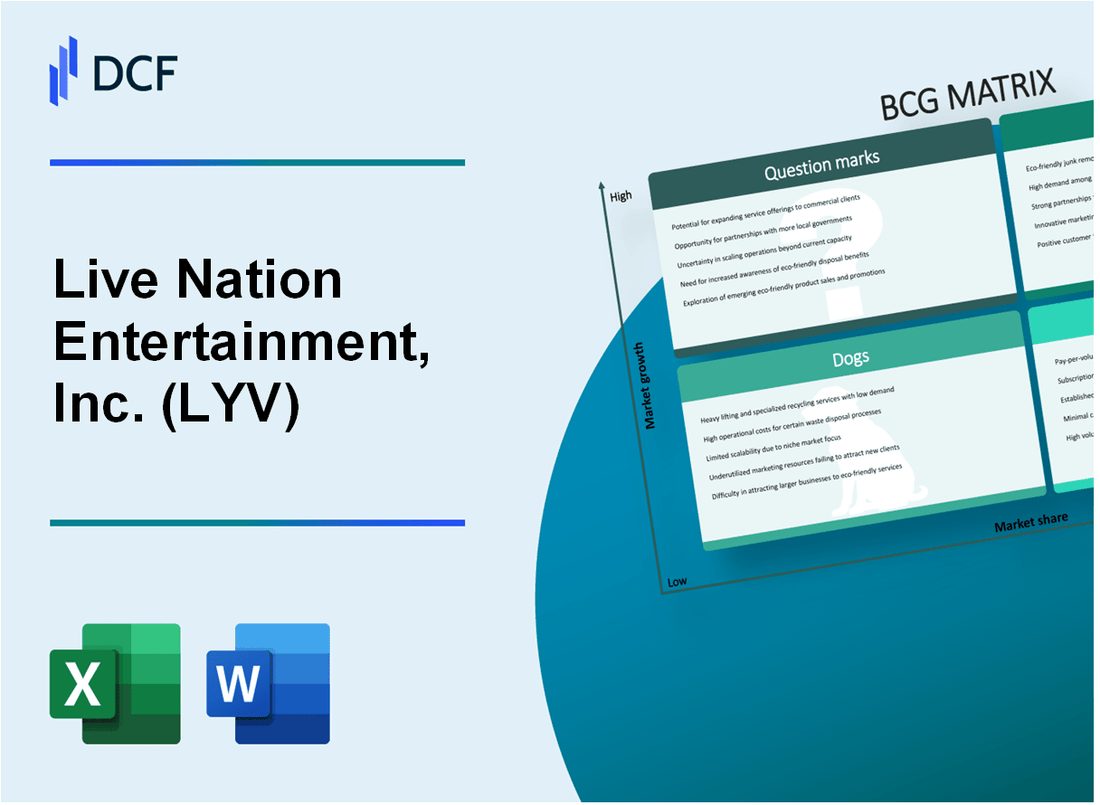
Live Nation Entertainment, Inc. (LYV) - BCG Matrix: Stars
The Stars quadrant represents business units within Live Nation Entertainment, Inc. (LYV) that command a high market share within rapidly expanding markets. These units are the current leaders and require significant investment to maintain their growth trajectory and eventually transition into Cash Cows as market growth matures.
The Concerts Segment is a clear Star, demonstrating robust top-line expansion. For the second quarter of 2025, this segment delivered revenue of nearly $5.95 billion, marking a significant 19% year-over-year growth, which clearly signals a high-growth market environment for Live Nation Entertainment, Inc. (LYV). This performance was achieved despite staging slightly fewer events, with 14,292 shows in Q2 2025 compared to approximately 14,678 in Q2 2024, suggesting a focus on larger, higher-yield events.
Global expansion is a major driver for these Star assets. The company saw its overall global fan count reach 44 million in Q2 2025, a 14% increase. Specifically, the International Concert Expansion is outpacing domestic growth; fan count in international markets grew over 30% in Q2 2025, with arena fan count up 20%. This international strength is expected to continue, with the CEO noting that growth is led by international markets, where fan count is on track to surpass the U.S. for the first time.
The focus on large-scale events, such as Global Stadium Tours, is a key component of the Star strategy. The pipeline for stadium shows was reported up 60% in Q3 2025 compared to the prior year, indicating massive future revenue potential. This focus on large venues is paying off in attendance, as stadium attendance tripled year-over-year in Q2 2025.
The Sponsorship & Advertising unit, which supports the high-volume concert business, also exhibits Star-like characteristics due to its high profitability and growth. For the third quarter of 2025, this segment delivered an AOI (Adjusted Operating Income) margin of 71%. The company is on track to deliver a double-digit increase in AOI for the full year 2025, which aligns with the investment needs of a Star category business.
Here is a summary of the key performance indicators for the identified Star segments based on the latest reported periods:
| Segment/Metric | Reporting Period | Value | Year-over-Year Change |
| Concerts Revenue | Q2 2025 | $5.95 billion | +19% |
| Global Fan Count | Q2 2025 | 44 million fans | +14% |
| International Fan Count Growth | Q2 2025 | Over 30% growth | N/A |
| Global Stadium Show Count | Q3 2025 | N/A | +60% |
| Sponsorship & Advertising AOI Margin | Q3 2025 | 71% | N/A |
The investment thesis for these Stars centers on maintaining market share through continued expansion and capital deployment:
- Invest in expanding the global venue portfolio, with plans for ten new large venues to open in 2026.
- Continue investing in artists and fan experiences to meet the momentum in touring growth.
- Capitalize on international expansion, where fan count growth is leading the overall increase.
- Sustain high-yield event focus, as seen by stadium attendance tripling year-over-year in Q2 2025.
Live Nation Entertainment, Inc. (LYV) - BCG Matrix: Cash Cows
The Cash Cow quadrant represents the core, market-leading businesses within Live Nation Entertainment, Inc. that generate significant cash flow from mature markets, requiring minimal new investment to maintain their dominant position. These units fund the company's growth initiatives and shareholder returns.
Ticketing Segment (Ticketmaster) is a prime example. The segment is expected to deliver a full-year Adjusted Operating Income (AOI) margin in the high 30s for 2025. For the third quarter of 2025, the Ticketing AOI margin stood at 36%, with AOI reaching $286 million, marking a substantial 21% year-over-year gain.
The high-margin fee revenue stream is directly tied to transaction volume. For the third quarter of 2025, the fee-bearing Gross Transaction Value (GTV) saw a strong increase of 12% compared to the third quarter of 2024. Looking at the period through October, the total fee-bearing GTV was up 7%, with Primary fee-bearing GTV growing 8%.
Future cash flow visibility is exceptionally strong, evidenced by record deferred revenue balances. Concerts event-related deferred revenue hit a record $5.4 billion in the first quarter of 2025, representing a 24% increase compared to the prior year. By the third quarter of 2025, event-related deferred revenue remained robust at $3.5 billion, up 37% year-over-year, and Ticketmaster deferred revenue was $231 million, up 30%.
The North American venue portfolio, operating under Venue Nation, provides consistent returns through high on-site spending. Fan spending across amphitheaters showed continued growth, up 8% year-to-date in Q3 2025. Major festivals, defined as those with over 100,000 fans, saw on-site spending increase by 6% year-to-date. Furthermore, specific product innovations drove spending higher, with non-alcoholic beverage spending rising by 20% per fan.
Here are the key financial metrics supporting the Cash Cow status for the Ticketing and On-Site Spending components as of Q3 2025:
| Metric | Segment/Basis | Value | Change (YoY/YTD) |
| Adjusted Operating Income (AOI) | Ticketing | $286 million | Up 21% |
| Fee-Bearing GTV | Ticketing (Q3) | N/A | Up 12% |
| Fee-Bearing GTV | Total (Through October) | N/A | Up 7% |
| On-Site Spending Growth | Amphitheaters (YTD) | N/A | Up 8% |
| On-Site Spending Growth | Major Festivals (YTD) | N/A | Up 6% |
The strength in these established areas is clear from the segment performance summary for the third quarter of 2025:
- Concerts segment revenue: $7.3 billion, up 11%.
- Ticketing revenue: $798 million, up 15%.
- Sponsorship & Advertising revenue: $443 million, up 13%.
- Concerts segment hosted over 51 million fans in Q3.
- Stadium show count globally was up 60%.
The company is defintely milking these established, high-share businesses. Finance: draft 13-week cash view by Friday.
Live Nation Entertainment, Inc. (LYV) - BCG Matrix: Dogs
Dogs, are units or products with a low market share and low growth rates. They frequently break even, neither earning nor consuming much cash. Dogs are generally considered cash traps because businesses have money tied up in them, even though they bring back almost nothing in return. These business units are prime candidates for divestiture.
Non-Concert Ticketing
You're looking at the segment that shows clear signs of being a Dog, characterized by low growth and, in this case, a reported decline. The data from the first quarter of 2025 shows this weakness clearly. Non-concert categories, which include sports, arts, and family events, saw their ticket volume fall by 9% year-over-year in Q1 2025. This segment represented a significant portion of the overall volume, making up 40% of tickets sold. The revenue for the entire Ticketing segment in Q1 was $694.7 million, a 4% decrease year-over-year.
Here are the segment details from Q1 2025:
| Metric | Value | Context/Comparison |
| Non-Concert Ticket Volume Change (YoY) | -9% | Q1 2025 Decline |
| Share of Total Ticket Volume | 40% | Non-concerts tickets comprised this share |
| Total Ticketing Segment Revenue (Q1 2025) | $694.7 million | Reported Q1 revenue |
| Ticketing Segment Revenue Change (YoY) | -4% | Q1 decrease |
Smaller, Underperforming Festivals
While Live Nation Entertainment, Inc. boasts high-demand major global festivals like EDC Vegas and Lollapalooza Chicago, which are performing well, the lower tier of events likely falls into the Dog category. These are events with inconsistent attendance or high operational costs that don't achieve the necessary scale for profitability. Although specific 2025 figures for smaller festivals aren't broken out, the overall weakness in non-concert categories points to this issue. For context on the broader festival environment, over 170 festival cancellations were identified during 2024.
The characteristics of these potential Dogs include:
- Events with inconsistent attendance.
- High operational costs that don't scale.
- Low market share relative to major tentpole events.
- Reliance on local or regional markets without global reach.
Legacy Ticketing Contracts
Older, lower-margin contracts with third-party venues that lack the full Live Nation Entertainment, Inc. ecosystem integration represent a drag, as they don't benefit from the same efficiencies or revenue capture as newer, fully integrated deals. A financial indicator of these legacy obligations is the amortization expense related to them. For the first six months of 2025, the amortization of non-recoupable ticketing contract advances was $45.4 million. This recurring, non-cash charge ties up capital in older agreements that may not offer competitive margins compared to current deals.
Currency-Exposed International Operations
Operations in certain international markets, particularly Latin America, introduce volatility that acts as a headwind on reported financials, effectively lowering the return on otherwise solid operations. In Q1 2025, foreign exchange fluctuations impacted Live Nation Entertainment, Inc.'s operating income by 11%. The Adjusted Operating Income (AOI) was impacted by 5% due to these currency movements. The company noted that the Mexican Peso and other Latin American currencies were the primary drivers of this negative impact.
The impact breakdown for Q1 2025 was:
- Operating Income FX Impact: 11% reduction.
- AOI FX Impact: 5% reduction.
- Approximately 60% of the total FX impact was absorbed by Ticketmaster.
If onboarding takes 14+ days, churn risk rises. Finance: draft 13-week cash view by Friday.
Live Nation Entertainment, Inc. (LYV) - BCG Matrix: Question Marks
QUESTION MARKS (high growth products (brands), low market share):
These business units operate in markets Live Nation Entertainment, Inc. is aggressively pursuing for growth but currently hold a relatively smaller market share compared to established segments. They require significant cash deployment to scale quickly.
Venue Expansion Capital Expenditure: Investing heavily in physical assets to capture future market share represents a major cash drain with high upfront risk, though projected returns are strong.
| Metric | Value (2025 Fiscal Year Data) |
| Total Estimated 2025 Capital Expenditures | $900 million to $1 billion |
| Capital Expenditure for Venue Expansion/Enhancement | $700 million to $800 million |
| Expected Internal Rate of Return (IRR) on Venue Investments | Averaging 20%+ |
| New U.S. Venues Announced (June 2025) | 18 new and revitalized venues |
| Total New Major Venues Expected to Open in 2026 | Ten |
| U.S. Venue Portfolio Share of National Total (Approximate) | 4% |
AI-Driven Ticketing Innovation: Investments in technology to maintain competitive advantage and combat issues like botting require capital without immediate, proven returns on investment across the entire platform.
- AI integration supports long-term profitability in ticketing.
- Ticketmaster Gross Transaction Value (GTV) increased 7% to $9 billion in Q2 2025.
- Ticketmaster deferred revenue was $270 million in Q1 2025, up 13% year-over-year.
- Ticketmaster expects double-digit AOI growth in Q3 2025.
New International Market Entry: Aggressive expansion into territories like Asia-Pacific and Latin America shows high growth potential but currently represents a smaller share of overall market penetration compared to core U.S. operations.
- International markets drove 75% of the growth in Ticketmaster Deferred Revenue in Q3 2025.
- Total fee-bearing GTV was up 7% in Q3 2025, fueled by international markets up 16%.
- Global attendance in Q2 2025 was up 14% to 44 million fans, with overall fan count in international markets up over 30%.
- Ticketmaster added 17 million net new enterprise tickets year-to-date (as of September 2025), with approximately 70% coming from international markets.
Artist Services and Management: While core to the business, the competition for top-tier talent necessitates substantial ongoing financial commitments that may not yield immediate, high-margin returns relative to the investment required.
Live Nation Entertainment committed $15 billion in artist events globally for 2025. The Concerts segment generated revenue of $5,946.4 million in Q2 2025, a 19% increase.
Disclaimer
All information, articles, and product details provided on this website are for general informational and educational purposes only. We do not claim any ownership over, nor do we intend to infringe upon, any trademarks, copyrights, logos, brand names, or other intellectual property mentioned or depicted on this site. Such intellectual property remains the property of its respective owners, and any references here are made solely for identification or informational purposes, without implying any affiliation, endorsement, or partnership.
We make no representations or warranties, express or implied, regarding the accuracy, completeness, or suitability of any content or products presented. Nothing on this website should be construed as legal, tax, investment, financial, medical, or other professional advice. In addition, no part of this site—including articles or product references—constitutes a solicitation, recommendation, endorsement, advertisement, or offer to buy or sell any securities, franchises, or other financial instruments, particularly in jurisdictions where such activity would be unlawful.
All content is of a general nature and may not address the specific circumstances of any individual or entity. It is not a substitute for professional advice or services. Any actions you take based on the information provided here are strictly at your own risk. You accept full responsibility for any decisions or outcomes arising from your use of this website and agree to release us from any liability in connection with your use of, or reliance upon, the content or products found herein.