
|
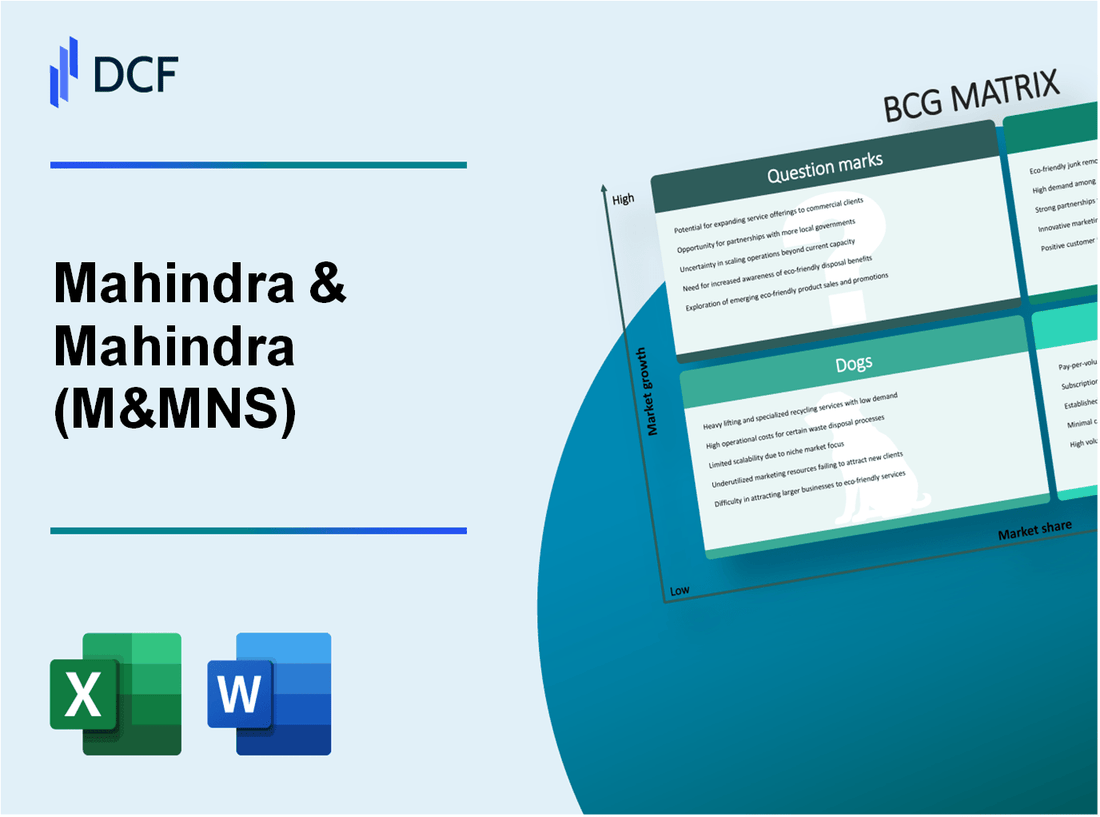
Mahindra & Mahindra Limited (M&M.NS): BCG Matrix |
Fully Editable: Tailor To Your Needs In Excel Or Sheets
Professional Design: Trusted, Industry-Standard Templates
Investor-Approved Valuation Models
MAC/PC Compatible, Fully Unlocked
No Expertise Is Needed; Easy To Follow
Mahindra & Mahindra Financial Services Limited (M&M.NS) Bundle
In the dynamic landscape of Mahindra & Mahindra Limited, understanding the positioning of its diverse portfolio through the Boston Consulting Group (BCG) Matrix can offer valuable insights to investors and business analysts alike. From the booming electric vehicle sector to the underperforming two-wheeler segment, each quadrant reveals key growth opportunities and potential risks. Join us as we delve into the stars, cash cows, dogs, and question marks of Mahindra's business, and uncover how these classifications impact the company's future prospects.
Background of Mahindra & Mahindra Limited
Founded in 1945, Mahindra & Mahindra Limited (M&M) is a prominent player in the automotive and farm equipment sectors in India. Originally established as a steel trading company, M&M quickly diversified into manufacturing utility vehicles and tractors. Over the decades, it has transformed into a leading multinational with operations spanning across 100 countries.
M&M is part of the Mahindra Group, a conglomerate with interests in various industries, including aerospace, agribusiness, and information technology. The company’s automotive segment includes a wide range of vehicles, from SUVs to electric cars, while its farm equipment division is a significant contributor to its revenues, producing tractors and farm implements.
Financially, M&M reported a revenue of approximately ₹1.05 trillion in the fiscal year 2022, with a robust net profit of ₹83 billion. The company's market capitalization as of October 2023 stands at around ₹1.5 trillion. M&M is consistently recognized for its innovation and sustainability efforts, aiming to reduce its carbon footprint through electric mobility initiatives.
As of late 2023, Mahindra & Mahindra's stock has shown resilience, trading around ₹1,500 per share, reflecting a solid growth trajectory in the context of a fluctuating market. The company’s strategic initiatives, including collaborations with global technology firms, have further solidified its position as a frontrunner in the automotive sector.
Mahindra & Mahindra Limited - BCG Matrix: Stars
Electric Vehicles Growth
Mahindra Electric Mobility Limited, a subsidiary of Mahindra & Mahindra, has been a significant player in the electric vehicle (EV) segment in India. The company reported a sales growth of around 300% in its EV segment during the fiscal year 2022-2023, driven by rising consumer interest and favorable government policies. The company aims to sell 100,000 electric vehicles annually by 2025.
In 2022, Mahindra launched its flagship EV, the Mahindra XUV400, which received over 3,000 bookings within the first week of its launch. The company has committed an investment of ₹10,000 crore (approximately $1.35 billion) towards the development of electric vehicles over the next few years.
Farm Equipment Business
The farm equipment division of Mahindra & Mahindra is another star within its portfolio. The company holds a commanding market share of 44% in the Indian tractor market as of FY 2022, making it the largest seller of tractors in the country. Mahindra sold over 221,000 tractors in the fiscal year 2022-2023, showing a year-over-year growth of about 15%.
The company has reported a revenue of ₹15,500 crore (approximately $2.1 billion) in the farm equipment sector for FY 2022-2023, contributing significantly to the overall profitability. Additionally, Mahindra aims to enhance its global footprint, targeting sales of 50,000 tractors in international markets by 2025.
Compact SUVs
In the compact SUVs segment, Mahindra's models like the XUV300 and the Thar have gained immense popularity. The compact SUV segment in India grew by 24% in FY 2022, with Mahindra securing a market share of approximately 15% in this category. The company reported sales of 140,000 units for its compact SUVs in the last fiscal year.
In Q1 2023, Mahindra's revenue from the SUV segment was around ₹10,000 crore (approximately $1.35 billion), reflecting a growth of 20% from the previous quarter. The Thar SUV has been particularly successful, with over 40,000 units sold in its first year of launch, establishing it as a significant growth driver for Mahindra.
| Business Unit | Market Share | Units Sold (FY 2022-2023) | Revenue (FY 2022-2023) | Growth Rate |
|---|---|---|---|---|
| Electric Vehicles | Leading in EV segment | 3,000 (XUV400 bookings) | Not disclosed (part of ₹10,000 crore investment) | 300% |
| Farm Equipment | 44% | 221,000 | ₹15,500 crore (~$2.1 billion) | 15% |
| Compact SUVs | 15% | 140,000 | ₹10,000 crore (~$1.35 billion) | 20% |
Mahindra & Mahindra Limited - BCG Matrix: Cash Cows
Mahindra & Mahindra Limited (M&M) holds a significant position in the Indian automotive and agriculture sectors, with specific segments classified as Cash Cows under the BCG Matrix. These segments generate substantial cash flow due to their high market share despite operating in low growth markets.
Utility Vehicles Segment
The Utility Vehicles (UV) segment is a cornerstone of M&M's operations, dominating the market with a share of approximately 40%. In FY2023, the UV segment reported revenues of around ₹25,000 crores (approximately $3 billion), driven by robust sales of popular models like the Mahindra Thar and XUV700. With a profit margin of about 15%, this segment provides significant cash flow that supports other business units.
M&M has strategically focused on optimizing production costs and enhancing supply chain efficiency, which has further solidified its competitive advantage in this segment. The company’s emphasis on regional design and localization has decreased costs and improved margins.
Tractors and Agricultural Machinery
The Tractors and Agricultural Machinery segment is another prime Cash Cow for Mahindra. As the largest tractor manufacturer in India, M&M commands a market share of approximately 43%. In FY2023, the tractors segment generated revenues of about ₹14,500 crores (around $1.75 billion). The profit margins in this segment are notably strong at around 18%, emphasizing the segment's ability to generate substantial cash flow.
This segment benefits from low promotional expenditure and a loyal customer base, facilitating stable cash generation. The focus on advanced technology and easy financing options has enhanced customer reach, contributing to consistent cash inflow.
Financial Services
M&M’s Financial Services division includes loans and insurance products that cater primarily to the automotive sector. This division contributes significantly to the company’s cash flow, reporting revenues of approximately ₹8,500 crores (nearly $1.02 billion) in FY2023, with a profit margin of 20%.
The Financial Services segment operates with a strong asset quality ratio, maintaining a non-performing asset (NPA) ratio of less than 2%. This stability enables M&M to mitigate risks while enjoying high liquidity and cash generation capabilities. The division is strategically supported by cross-selling opportunities within M&M's automotive and agricultural platforms, enhancing overall profitability.
| Segment | Market Share | Revenue FY2023 (₹ crores) | Profit Margin (%) |
|---|---|---|---|
| Utility Vehicles | 40% | 25,000 | 15% |
| Tractors and Agricultural Machinery | 43% | 14,500 | 18% |
| Financial Services | N/A | 8,500 | 20% |
These Cash Cow segments collectively enable Mahindra & Mahindra to sustain its growth trajectory, providing financial stability to invest in emerging opportunities while ensuring shareholder value through dividends and reinvestment strategies.
Mahindra & Mahindra Limited - BCG Matrix: Dogs
Within Mahindra & Mahindra Limited, several segments can be categorized as Dogs in the BCG Matrix due to their low market share and low growth rates. Analyzing these units reveals critical insights into the company's portfolio and performance.
Two-Wheeler Segment
The Two-Wheeler segment of Mahindra & Mahindra has faced various challenges in recent years. For the fiscal year ending March 2023, the segment reported revenues of approximately ₹1,000 crores, which was a stagnation from the previous year's ₹1,020 crores. Market share in this segment is below 5% in the Indian two-wheeler market, which is dominated by competitors like Hero MotoCorp and Bajaj Auto.
Despite new launches, the segment's growth has been impeded by increasing competition and changing consumer preferences. Sales volume for the Two-Wheeler segment in FY2023 stood at about 100,000 units, reflecting a decline of 10% compared to the previous year.
SsangYong Motor Company
SsangYong Motor Company, a subsidiary of Mahindra & Mahindra, continues to represent a challenging investment. For the fiscal year 2022, SsangYong reported a net loss of approximately ₩1.3 trillion (about ₹800 crores) while only selling around 66,700 vehicles. This equates to a market share of less than 1% in the South Korean automotive market, where domestic players control most of the market.
The company has struggled with profitability, reporting a cumulative loss of over ₩2.3 trillion (approximately ₹1,400 crores) over the past five years. In 2023, Mahindra announced plans to divest its stake in SsangYong to minimize losses.
Mahindra Racing
Mahindra Racing, despite its historical presence in Formula E and other racing initiatives, has not generated significant commercial success. For the 2023 season, the racing division reported revenues of approximately ₹150 crores, but incurred operational losses of around ₹50 crores. The market engagement primarily focuses on brand visibility rather than sustainable revenue generation.
Over the past three seasons, Mahindra Racing has finished consistently in the lower tier of standings, which has negatively impacted sponsorship attractiveness and investment viability. The total expenditure related to racing activities has reached approximately ₹200 crores annually, positioning it as a cash drain on Mahindra & Mahindra's overall financials.
| Segment | Revenue (FY2023) | Market Share | Losses/Expenditures | Units Sold |
|---|---|---|---|---|
| Two-Wheeler | ₹1,000 crores | 5% | N/A | 100,000 |
| SsangYong Motor Company | N/A | 1% | ₩1.3 trillion (₹800 crores) | 66,700 |
| Mahindra Racing | ₹150 crores | N/A | ₹50 crores | N/A |
The analysis of these Dogs within Mahindra & Mahindra Limited highlights the need for strategic reevaluation. Divestiture or scaling back operations in these segments may be essential for reinvesting resources into more profitable areas of the business.
Mahindra & Mahindra Limited - BCG Matrix: Question Marks
Mahindra Aerospace
Mahindra Aerospace operates in the rapidly growing aerospace segment, which has a projected CAGR of approximately 4.4% from 2022 to 2027. However, Mahindra’s market share in this sector remains relatively low, with estimates showing it at around 2% compared to larger players like Boeing and Airbus.
The company reported revenues of approximately INR 1,000 crore (about USD 135 million) in FY 2022, highlighting its potential but also its need for substantial investment to enhance its market position. Its R&D expenditure is noted to be around INR 100 crore annually, aimed at developing innovative solutions and expanding its product line.
GenZe Electric Bikes
GenZe, a subsidiary focused on electric bikes, is entering a high-growth market fueled by increasing demand for sustainable transportation solutions. The global electric bike market is expected to grow at a CAGR of 12.6% from 2021 to 2028. GenZe has yet to capture significant market share, estimated at just 0.5% of the U.S. electric bike market.
In FY 2022, GenZe reported revenues of approximately INR 150 crore (around USD 20 million), but it incurs operational losses due to high production costs and limited distribution. Investment needs are projected at around INR 200 crore over the next two years to expand manufacturing capabilities and marketing outreach extensively.
Mahindra Holidays and Resorts India
In the hospitality sector, Mahindra Holidays operates in a growing market, with the Indian hospitality industry expected to grow at a CAGR of 9% from 2022 to 2027. Despite this growth, Mahindra Holidays holds a market share of approximately 3%. Their revenue in FY 2022 stood at about INR 1,200 crore (around USD 162 million), reflecting their potential yet revealing struggles to fully capitalize on market opportunities.
Despite having a substantial member base of over 250,000, the product offerings remain underutilized. The company plans to invest around INR 300 crore in enhancing their resort infrastructure and digital marketing strategies to improve visibility and attract new customers.
| Product/Brand | Market Growth Rate | Market Share | Revenue FY 2022 | Investment Needs | Key Challenges |
|---|---|---|---|---|---|
| Mahindra Aerospace | 4.4% | 2% | INR 1,000 crore (USD 135 million) | INR 100 crore | Low market share, high competition |
| GenZe Electric Bikes | 12.6% | 0.5% | INR 150 crore (USD 20 million) | INR 200 crore | High production costs, limited distribution |
| Mahindra Holidays and Resorts India | 9% | 3% | INR 1,200 crore (USD 162 million) | INR 300 crore | Utilization of offerings, visibility issues |
In evaluating Mahindra & Mahindra Limited through the lens of the BCG Matrix, we see a dynamic interplay of growth and stability, with its ambitious ventures in electric vehicles and compact SUVs poised to become tomorrow's stars, while its utility vehicles and tractors continue to shine as reliable cash cows. However, challenges persist in the two-wheeler segment and the international arena with SsangYong, presenting considerations for the future. As Mahindra navigates these diverse categories, its strategic focus on innovation and market adaptability will be crucial for maintaining its competitive edge in a rapidly evolving landscape.
[right_small]Disclaimer
All information, articles, and product details provided on this website are for general informational and educational purposes only. We do not claim any ownership over, nor do we intend to infringe upon, any trademarks, copyrights, logos, brand names, or other intellectual property mentioned or depicted on this site. Such intellectual property remains the property of its respective owners, and any references here are made solely for identification or informational purposes, without implying any affiliation, endorsement, or partnership.
We make no representations or warranties, express or implied, regarding the accuracy, completeness, or suitability of any content or products presented. Nothing on this website should be construed as legal, tax, investment, financial, medical, or other professional advice. In addition, no part of this site—including articles or product references—constitutes a solicitation, recommendation, endorsement, advertisement, or offer to buy or sell any securities, franchises, or other financial instruments, particularly in jurisdictions where such activity would be unlawful.
All content is of a general nature and may not address the specific circumstances of any individual or entity. It is not a substitute for professional advice or services. Any actions you take based on the information provided here are strictly at your own risk. You accept full responsibility for any decisions or outcomes arising from your use of this website and agree to release us from any liability in connection with your use of, or reliance upon, the content or products found herein.