
|
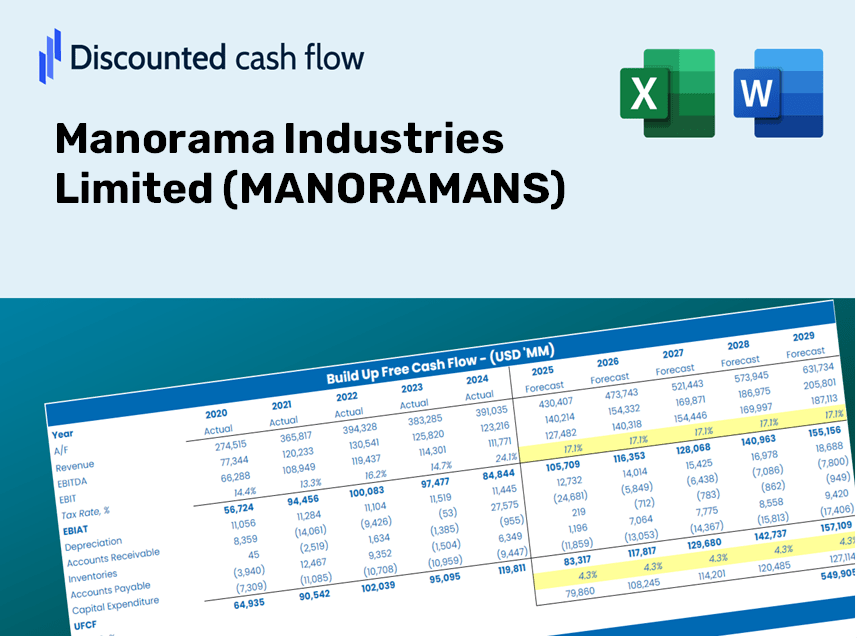
Manorama Industries Limited (MANORAMA.NS) DCF Valuation |
Fully Editable: Tailor To Your Needs In Excel Or Sheets
Professional Design: Trusted, Industry-Standard Templates
Investor-Approved Valuation Models
MAC/PC Compatible, Fully Unlocked
No Expertise Is Needed; Easy To Follow
Manorama Industries Limited (MANORAMA.NS) Bundle
Discover the true value of Manorama Industries Limited (MANORAMANS) with our advanced DCF Calculator! Adjust key assumptions, experiment with various scenarios, and evaluate how changes affect the valuation of Manorama Industries Limited (MANORAMANS) – all within one comprehensive Excel template.
What You Will Gain
- Pre-Configured Financial Model: Utilizing Manorama Industries Limited’s (MANORAMANS) actual figures for accurate DCF valuation.
- Comprehensive Forecast Management: Modify revenue growth, profit margins, WACC, and other essential parameters.
- Real-Time Calculations: Automatic updates provide instant feedback as you adjust inputs.
- Professional-Grade Template: A polished Excel file crafted for high-quality valuation presentations.
- Versatile and Reusable: Designed for adaptability, making it easy to conduct detailed forecasts repeatedly.
Key Features
- Pre-Loaded Data: Historical financial statements of Manorama Industries Limited and pre-filled forecasts.
- Fully Adjustable Inputs: Modify WACC, tax rates, revenue growth, and EBITDA margins as needed.
- Instant Results: Watch the intrinsic value of Manorama Industries Limited recalibrate in real time.
- Clear Visual Outputs: Interactive dashboard charts present valuation results and essential metrics.
- Built for Accuracy: A sophisticated tool designed for analysts, investors, and finance professionals.
How It Functions
- Download the Template: Gain immediate access to the Excel-based MANORAMANS DCF Calculator.
- Input Your Assumptions: Modify the yellow-highlighted fields for growth rates, WACC, profit margins, and additional variables.
- Instant Calculations: The model automatically refreshes to provide MANORAMANS’ intrinsic value.
- Test Scenarios: Explore various assumptions to assess potential changes in valuation.
- Analyze and Decide: Leverage the results to inform your investment or financial strategies.
Why Select This Calculator for Manorama Industries Limited (MANORAMANS)?
- Designed for Experts: A sophisticated tool tailored for analysts, CFOs, and consultants.
- Accurate Data: Historical and projected financial information for Manorama Industries is preloaded for precision.
- Flexible Scenario Analysis: Effortlessly simulate various forecasts and assumptions.
- Comprehensive Outputs: Automatically computes intrinsic value, NPV, and essential metrics.
- User-Friendly: Clear, step-by-step guidance ensures a smooth experience.
Who Can Benefit from This Product?
- Investors: Evaluate the valuation of Manorama Industries Limited (MANORAMANS) before making investment decisions.
- CFOs and Financial Analysts: Enhance the efficiency of valuation processes and assess future projections.
- Startup Founders: Understand how established companies like Manorama Industries Limited (MANORAMANS) are valued in the market.
- Consultants: Provide clients with comprehensive and professional valuation reports.
- Students and Educators: Utilize real-world data to practice and instruct on valuation methodologies.
Contents of the Template
- Pre-Filled Data: Contains historical financials and forecasts for Manorama Industries Limited (MANORAMANS).
- Discounted Cash Flow Model: An editable DCF valuation model with automated calculations.
- Weighted Average Cost of Capital (WACC): A specific sheet for WACC calculations based on user-defined inputs.
- Key Financial Ratios: Evaluate the profitability, efficiency, and leverage of Manorama Industries Limited (MANORAMANS).
- Customizable Inputs: Easily modify inputs for revenue growth, profit margins, and tax rates.
- Clear Dashboard: Visual representations through charts and tables summarizing essential valuation results.
Disclaimer
All information, articles, and product details provided on this website are for general informational and educational purposes only. We do not claim any ownership over, nor do we intend to infringe upon, any trademarks, copyrights, logos, brand names, or other intellectual property mentioned or depicted on this site. Such intellectual property remains the property of its respective owners, and any references here are made solely for identification or informational purposes, without implying any affiliation, endorsement, or partnership.
We make no representations or warranties, express or implied, regarding the accuracy, completeness, or suitability of any content or products presented. Nothing on this website should be construed as legal, tax, investment, financial, medical, or other professional advice. In addition, no part of this site—including articles or product references—constitutes a solicitation, recommendation, endorsement, advertisement, or offer to buy or sell any securities, franchises, or other financial instruments, particularly in jurisdictions where such activity would be unlawful.
All content is of a general nature and may not address the specific circumstances of any individual or entity. It is not a substitute for professional advice or services. Any actions you take based on the information provided here are strictly at your own risk. You accept full responsibility for any decisions or outcomes arising from your use of this website and agree to release us from any liability in connection with your use of, or reliance upon, the content or products found herein.