
|
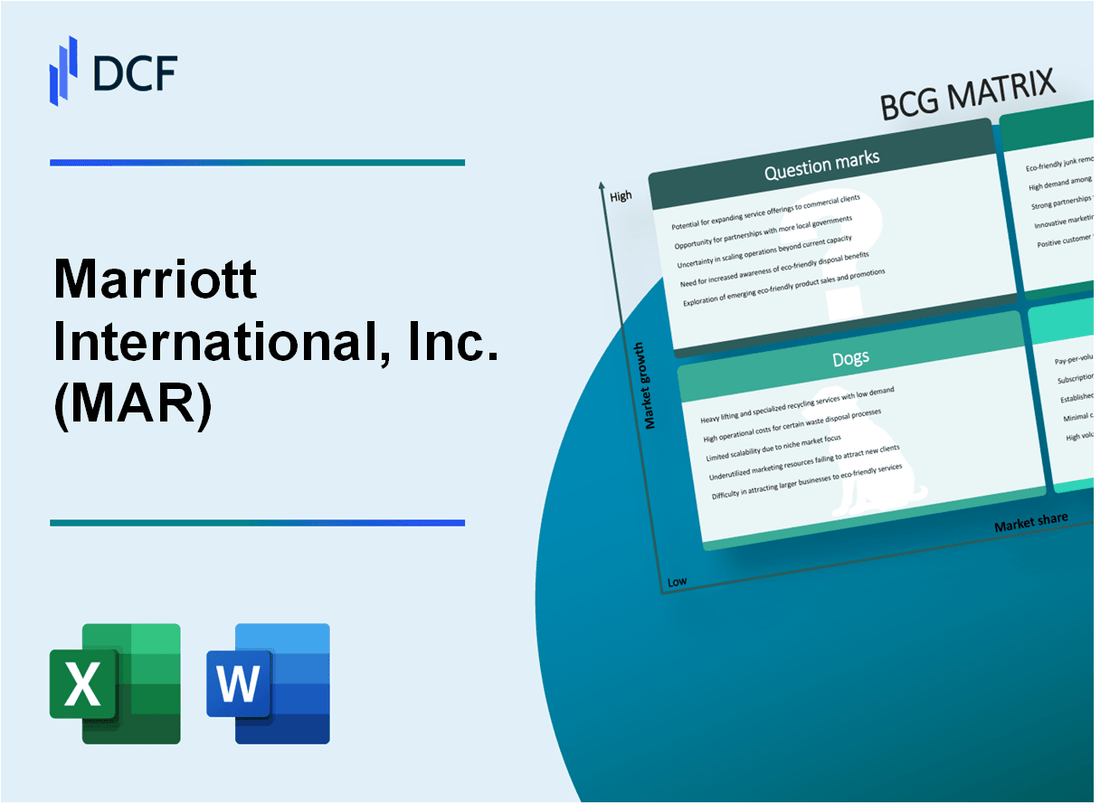
Marriott International, Inc. (MAR): BCG Matrix [Dec-2025 Updated] |
Fully Editable: Tailor To Your Needs In Excel Or Sheets
Professional Design: Trusted, Industry-Standard Templates
Investor-Approved Valuation Models
MAC/PC Compatible, Fully Unlocked
No Expertise Is Needed; Easy To Follow
Marriott International, Inc. (MAR) Bundle
You're trying to figure out exactly where Marriott International, Inc. (MAR) should be placing its next big capital bets, and frankly, the landscape is a mix of clear winners and necessary clean-up jobs as of late 2025. We've cut through the noise to map their business units using the four-quadrant framework: you'll see the high-growth Stars like Luxury Brands and the massive Cash Cows like the nearly 260 million Bonvoy members funding the operation, but you also need to see the Dogs-those underperforming legacy properties-and the Question Marks like the -1.6% Q1 RevPAR dip in Greater China that demand immediate strategic attention. Keep reading to see the precise breakdown of where MAR is generating its $1,071 million in franchise fees and where it needs to make tough calls on investment and divestment.
Background of Marriott International, Inc. (MAR)
You're looking at Marriott International, Inc. (MAR) as of late 2025, and the picture is one of aggressive, asset-light expansion, especially internationally. This company, headquartered in Bethesda, Maryland, USA, remains one of the world's largest hospitality players, operating, franchising, and licensing hotel, residential, timeshare, and other lodging properties globally. As of the third quarter of 2025, Marriott International's global system stood at over 9,700 properties across more than 30 brands in 143 countries and territories.
The growth engine is clearly firing on all cylinders in terms of footprint. The worldwide development pipeline hit a new record at the end of Q3 2025, totaling approximately 3,900 properties and over 596,000 rooms. This pipeline supports the company's projection for net rooms growth to approach 5 percent for the full year 2025. The company added roughly 17,900 net rooms in the third quarter alone, marking a 4.7 percent growth in net rooms from the end of Q3 2024.
Financially, the story in 2025 reflects a split performance between domestic and international markets. For the third quarter of 2025, global Revenue Per Available Room (RevPAR) saw a slight increase of 0.5 percent worldwide, but this was driven by 2.6 percent growth in international markets, as the U.S. & Canada segment saw a 0.4 percent decline. Management still expects full-year global RevPAR growth to land between 1.5 and 2.5 percent. Still, the asset-light model is generating strong cash flow; Q3 2025 Adjusted EBITDA was $1,349 million, a 10 percent jump year-over-year, and reported net income rose 25 percent to $728 million compared to the prior year's third quarter.
Marriott is actively managing its portfolio and customer base. The Marriott Bonvoy loyalty program is a key asset, boasting nearly 248 million members as of June 2025. Strategically, the company continues to expand its luxury offerings while also launching new concepts, such as the Series by Marriott brand in the mid-scale to upscale space. On the other hand, the company recently ended its partnership with Sonder, signaling a pivot back toward its core, branded residential strategy in key regions like EMEA and APAC. You can expect them to return approximately $4.0 billion to shareholders in 2025 from buybacks and dividends.
Marriott International, Inc. (MAR) - BCG Matrix: Stars
The Star quadrant represents business units or brands within Marriott International, Inc. (MAR) that command a high market share in markets experiencing significant growth. These units are market leaders but require substantial ongoing investment to maintain their growth trajectory and eventually transition into Cash Cows as market growth matures.
Marriott International, Inc. (MAR)'s luxury segment, encompassing brands like The Ritz-Carlton and St. Regis, demonstrates Star characteristics due to its leading position in a segment still showing strong demand. This segment holds a 16.9% global market share for luxury hotels, placing it ahead of key competitors like Hyatt at 11.4% and Accor at 10% as of late 2023 data, positioning it as the segment leader.
International markets are a key growth engine, consuming cash for expansion but yielding strong returns. For the first quarter of 2025, international markets posted a Revenue Per Available Room (RevPAR) growth of 5.9%. This international strength was particularly pronounced in the Asia-Pacific region (APEC), which saw RevPAR growth of 10.9%.
The Branded Residential Portfolio is another high-growth area demanding investment. This business unit generated $2.1 billion in residential sales revenue for third-party developers in 2024, a figure that was nearly double the total from the prior year. This rapid scaling is characteristic of a Star investment.
The overall company growth rate supports the Star classification for key segments. Marriott International, Inc. (MAR) expects overall net rooms growth to approach 5% for the full year 2025. This rate is high for a company of Marriott International, Inc. (MAR)'s maturity, indicating continued heavy investment in new supply.
Here's a look at the key metrics supporting the Star classification for these high-growth, high-share areas:
| Metric/Segment | Value | Period/Context |
| Luxury Segment Global Market Share | 16.9% | Leading the segment |
| International Markets RevPAR Growth | 5.9% | Q1 2025 |
| APEC RevPAR Growth | 10.9% | Q1 2025 |
| Branded Residential Sales Revenue | $2.1 billion | 2024 for developers |
| Expected Full Year Net Rooms Growth | Approaching 5% | Full Year 2025 |
The investment focus in these areas is clear, aiming to solidify market leadership:
- Luxury portfolio pipeline includes over 260 hotels and resorts in development.
- Record first quarter room signings in 2025 totaled over 34,000 rooms.
- Two-thirds of the Q1 2025 room signings were in international markets.
- The development pipeline at the end of Q1 2025 totaled approximately 587,000 rooms.
If this success is sustained until market growth slows, these units are positioned to become the next generation of Cash Cows for Marriott International, Inc. (MAR).
Marriott International, Inc. (MAR) - BCG Matrix: Cash Cows
Cash Cows are the engine of Marriott International, Inc., representing mature, high-market-share brands that generate significant, reliable cash flow to fund other parts of the portfolio. This segment thrives on the company's asset-light business model, which minimizes capital expenditure while maximizing fee capture from a vast, established global footprint.
The strength of this model is clearly visible in the fee-based revenue streams. For the first quarter of 2025, base management and franchise fees totaled $1,071 million, representing a 7 percent increase year-over-year. By the third quarter of 2025, this revenue component continued its steady flow, with base management and franchise fees increasing nearly 6 percent to $1.190 billion compared to the prior year's third quarter. This consistent, high-margin revenue is the definition of a cash cow.
The Marriott Bonvoy Loyalty Program acts as a massive competitive moat, locking in customers and driving ancillary revenue. As of the end of the third quarter of 2025, total global membership reached nearly 260 million. This scale is monetized effectively; for instance, co-branded credit card fees alone saw a substantial 13% jump in Q3.
Here is a snapshot of the loyalty program's scale as of Q3 2025:
| Metric | Value | Period |
| Total Global Members | Nearly 260 million | Q3 2025 |
| Members Added in Q3 | 12 million | Q3 2025 |
| Member Penetration (Global) | 68% | Q3 2025 |
| Co-branded Credit Card Fee Growth | 13% | Q3 2025 |
The core U.S. and Canada Market remains a bedrock of this stability, even with recent softer demand in certain segments. At year-end 2024, Marriott International, Inc.'s portfolio in this region totaled over 1 million open rooms across 6,067 properties. While Q3 2025 RevPAR in the U.S. & Canada saw a 0.4 percent decline, the underlying structure is supported by strong forward-looking group business.
The reliability of the corporate segment provides predictable cash flow, which is crucial for a Cash Cow designation. You can see this in the forward-looking group metrics:
- Group RevPAR for business slated for 2025 was projected to be up 7 percent from the end of the third quarter of 2023.
- This contrasts with the Q3 2025 global RevPAR increase of 0.5 percent, showing the group segment's relative strength.
- The company expects to return approximately $4.0 billion to shareholders in 2025 through dividends and share repurchases, largely funded by these stable cash generators.
The company's overall system size at the end of Q3 2025 was over 9,700 properties and approximately 1.75 million rooms. This massive scale allows Marriott International, Inc. to achieve economies of scale, which CFO and EVP of Development Leeny Oberg noted results in the lowest affiliation cost relative to revenue in the industry.
Here's a look at the scale supporting the Cash Cow status at the end of Q3 2025:
| Metric | Value | Source Period |
| Total Global Properties | Over 9,700 | Q3 2025 |
| Total Global Rooms | Approximately 1.75 million | Q3 2025 |
| Net Rooms Growth (YOY) | 4.7 percent | Q3 2025 |
| Reported Net Income | $728 million | Q3 2025 |
You should focus on maintaining the efficiency of the infrastructure supporting these brands, as that directly boosts the cash flow you're seeing in the base fees. Finance: draft 13-week cash view by Friday.
Marriott International, Inc. (MAR) - BCG Matrix: Dogs
You're looking at the parts of Marriott International, Inc. (MAR) that aren't pulling their weight in the current economic climate. These are the low-growth, low-share businesses that tie up capital without delivering stellar returns. Honestly, expensive turnarounds here rarely pay off.
Underperforming Legacy Properties, which require capital expenditure but generate lower returns in mature, low-growth markets
The international picture isn't uniform; some key markets are definitely lagging. For instance, Greater China saw a RevPAR (Revenue per Available Room) decline of -1.6% in the first quarter of 2025 compared to the prior year. This regional softness is a primary driver behind the company projecting lower full-year 2025 profits than analysts initially expected.
Certain Select-Service/Budget Hotels in the U.S. and Canada, which saw soft sales and declining demand in 2025 due to cost-conscious travelers
In the core U.S. & Canada market, the softness is concentrated in the mid-tier. During the second quarter of 2025, RevPAR in the U.S. & Canada was flat year-over-year, but the select-service and extended-stay categories saw a decline of 1.5%. By the third quarter of 2025, the entire U.S. & Canada RevPAR segment actually declined 0.4% year-over-year. This points directly to cost-conscious travelers pulling back from these specific offerings.
Segments heavily reliant on U.S. Government travel, which accounted for about 4% of U.S. and Canada room nights in 2024 and saw reduced spending
Government travel is a clear headwind for the domestic business. In 2024, the U.S. Government segment represented about 4% of the U.S. and Canada region's room nights. The impact in 2025 is significant; in the second quarter of 2025, government room nights in the U.S. & Canada were down 16% year-over-year. This reduced spending is explicitly cited as the reason for the weaker performance in select-service hotels.
Here's the quick math on the performance of these challenged segments as of the latest reported quarters in 2025:
| Segment/Geography | Metric | Value/Change | Period |
| U.S. & Canada Select-Service/Extended-Stay RevPAR | Decline | 1.5% | Q2 2025 |
| U.S. & Canada RevPAR (Overall) | Decline | 0.4% | Q3 2025 |
| Greater China RevPAR | Decline | -1.6% | Q1 2025 |
| U.S. Government Room Nights | Decline | 16% | Q2 2025 |
| Worldwide RevPAR Growth Forecast (Full Year) | Range | 1.5% to 2.5% | 2025 Est. |
Older, non-core brands with low market share that lack the scale or growth of the flagship brands
While specific performance data for every legacy, non-core brand isn't broken out individually, the aggregate weakness in the select-service tier and the decline in incentive management fees strongly suggest these lower-tier, less-scaled brands are dragging performance. Incentive management fees, which are tied to property performance, declined to $148 million in the third quarter of 2025 from $159 million in Q3 2024, primarily due to weaker performance in the U.S. & Canada.
The overall picture for these units is:
- Avoidance is the default strategy for these units.
- They are candidates for divestiture.
- Expensive turn-around plans are generally avoided.
- They neither earn nor consume much cash, acting as cash traps.
The company's focus remains on high-growth areas, evidenced by international RevPAR rising 5.9% in Q1 2025, which contrasts sharply with the domestic softness.
Finance: draft 13-week cash view by Friday
Marriott International, Inc. (MAR) - BCG Matrix: Question Marks
These business units operate in high-growth markets but currently hold a relatively low market share, demanding significant cash investment to capture that potential growth. They are the units where Marriott International, Inc. must decide whether to heavily fund expansion or divest.
Greater China Market Uncertainty
The Greater China region represents a high-potential growth market for Marriott International, Inc., yet recent performance indicates significant uncertainty, placing it in the Question Mark quadrant due to market volatility impacting its growth trajectory.
- RevPAR in Greater China declined by -1.6% in the first quarter of 2025 compared to the prior year.
- This decline contrasted with a global RevPAR increase of 4.1% in Q1 2025.
- The company's full-year 2025 worldwide RevPAR growth guidance was lowered to a range of 1.5% to 3.5%, partly due to softness in markets like Greater China.
The strategic imperative here is to determine if investment can quickly reverse the RevPAR trend or if the market uncertainty warrants a reduced capital allocation.
New Midscale/Extended-Stay Brands in the U.S.
Marriott International, Inc.'s push into the U.S. transient midscale and extended-stay segments with City Express by Marriott and StudioRes represents high-growth initiatives that, by definition of being new entries, possess low current market share.
For City Express by Marriott, which is new to the U.S. and Canada market, the focus is on rapid conversion and signing velocity:
| Metric | City Express by Marriott (CALA Base) | City Express by Marriott (U.S./Canada Pipeline) |
| Open Properties (CALA) | 153 | N/A (U.S. debut) |
| Total Rooms (CALA) | 17,777 rooms | N/A |
| Signed Agreements (U.S./Canada) | N/A | Over 45 |
| Expected Openings (U.S./Canada) | N/A | Q2 2025 and later in 2025 |
| Bundled Fee (U.S./Canada) | N/A | 9% |
StudioRes, the extended-stay midscale brand in the U.S., is also a new entrant requiring investment to establish market presence. The company is offering a low bundled fee of 9% for this brand as well.
Recent Acquisitions: citizenM Integration
The acquisition of the citizenM brand, completed in July 2025, is a major capital deployment intended to capture growth in the lifestyle select-service segment. The investment requires heavy integration to realize its potential.
- Total acquisition cost was $355 million for the brand and intellectual property.
- The portfolio added 37 open hotels, comprising 8,789 rooms, to Marriott International, Inc.'s system.
- The transaction included potential earn-out payments to the seller up to $110 million based on future growth.
- Anticipated annual fee income from the open and under-construction portfolio was estimated around $30 million.
- If the purchase closed before year-end 2025, it was expected to help push full-year net rooms growth to approach 5%.
The immediate post-acquisition period is characterized by high cash consumption for integration before returns stabilize.
Homes & Villas by Marriott International
This alternative lodging segment is high-growth but competes against deeply entrenched players, meaning market share gains require continuous investment in inventory and technology.
- The platform expanded its listings to nearly 160,000 homes globally.
- International reservations have grown significantly, making up 38% of total bookings as of mid-2024 data.
- This represented a 39% growth in the total number of homes over the past year (relative to the June 2024 report).
The focus remains on scaling the inventory and leveraging the Marriott Bonvoy loyalty base to increase share against established vacation rental platforms.
Disclaimer
All information, articles, and product details provided on this website are for general informational and educational purposes only. We do not claim any ownership over, nor do we intend to infringe upon, any trademarks, copyrights, logos, brand names, or other intellectual property mentioned or depicted on this site. Such intellectual property remains the property of its respective owners, and any references here are made solely for identification or informational purposes, without implying any affiliation, endorsement, or partnership.
We make no representations or warranties, express or implied, regarding the accuracy, completeness, or suitability of any content or products presented. Nothing on this website should be construed as legal, tax, investment, financial, medical, or other professional advice. In addition, no part of this site—including articles or product references—constitutes a solicitation, recommendation, endorsement, advertisement, or offer to buy or sell any securities, franchises, or other financial instruments, particularly in jurisdictions where such activity would be unlawful.
All content is of a general nature and may not address the specific circumstances of any individual or entity. It is not a substitute for professional advice or services. Any actions you take based on the information provided here are strictly at your own risk. You accept full responsibility for any decisions or outcomes arising from your use of this website and agree to release us from any liability in connection with your use of, or reliance upon, the content or products found herein.