
|
Marico Limited (MARICO.NS) DCF Valuation |
Fully Editable: Tailor To Your Needs In Excel Or Sheets
Professional Design: Trusted, Industry-Standard Templates
Investor-Approved Valuation Models
MAC/PC Compatible, Fully Unlocked
No Expertise Is Needed; Easy To Follow
Marico Limited (MARICO.NS) Bundle
Explore the financial outlook of Marico Limited (MARICONS) with our user-friendly DCF Calculator! Enter your assumptions for growth, margins, and costs to calculate the intrinsic value of Marico Limited (MARICONS) and shape your investment approach.
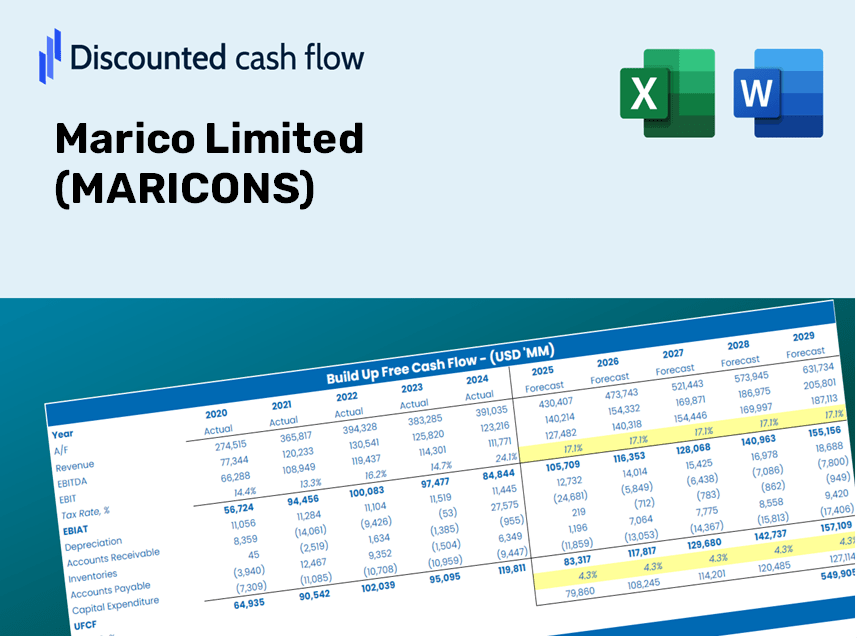
Discounted Cash Flow (DCF) - (USD MM)
| Year | AY1 2021 |
AY2 2022 |
AY3 2023 |
AY4 2024 |
AY5 2025 |
FY1 2026 |
FY2 2027 |
FY3 2028 |
FY4 2029 |
FY5 2030 |
|---|---|---|---|---|---|---|---|---|---|---|
| Revenue | 79,910.0 | 94,520.0 | 97,640.0 | 95,730.0 | 108,310.0 | 117,183.0 | 126,782.9 | 137,169.3 | 148,406.5 | 160,564.3 |
| Revenue Growth, % | 0 | 18.28 | 3.3 | -1.96 | 13.14 | 8.19 | 8.19 | 8.19 | 8.19 | 8.19 |
| EBITDA | 16,970.0 | 17,760.0 | 19,530.0 | 21,670.0 | 21,390.0 | 24,002.3 | 25,968.6 | 28,096.0 | 30,397.7 | 32,887.9 |
| EBITDA, % | 21.24 | 18.79 | 20 | 22.64 | 19.75 | 20.48 | 20.48 | 20.48 | 20.48 | 20.48 |
| Depreciation | 1,380.0 | 1,360.0 | 1,540.0 | 1,580.0 | 1,780.0 | 1,883.6 | 2,037.9 | 2,204.8 | 2,385.5 | 2,580.9 |
| Depreciation, % | 1.73 | 1.44 | 1.58 | 1.65 | 1.64 | 1.61 | 1.61 | 1.61 | 1.61 | 1.61 |
| EBIT | 15,590.0 | 16,400.0 | 17,990.0 | 20,090.0 | 19,610.0 | 22,118.7 | 23,930.7 | 25,891.1 | 28,012.2 | 30,307.0 |
| EBIT, % | 19.51 | 17.35 | 18.42 | 20.99 | 18.11 | 18.88 | 18.88 | 18.88 | 18.88 | 18.88 |
| Total Cash | 15,070.0 | 12,180.0 | 13,380.0 | 12,010.0 | 21,520.0 | 18,248.4 | 19,743.4 | 21,360.8 | 23,110.7 | 25,004.0 |
| Total Cash, percent | .0 | .0 | .0 | .0 | .0 | .0 | .0 | .0 | .0 | .0 |
| Account Receivables | 3,940.0 | 6,570.0 | 10,890.0 | 11,790.0 | 12,790.0 | 11,052.5 | 11,958.0 | 12,937.6 | 13,997.5 | 15,144.2 |
| Account Receivables, % | 4.93 | 6.95 | 11.15 | 12.32 | 11.81 | 9.43 | 9.43 | 9.43 | 9.43 | 9.43 |
| Inventories | 11,260.0 | 14,120.0 | 12,250.0 | 13,360.0 | 12,350.0 | 15,687.0 | 16,972.2 | 18,362.6 | 19,866.9 | 21,494.4 |
| Inventories, % | 14.09 | 14.94 | 12.55 | 13.96 | 11.4 | 13.39 | 13.39 | 13.39 | 13.39 | 13.39 |
| Accounts Payable | 11,340.0 | 13,440.0 | 14,520.0 | 15,810.0 | 13,630.0 | 16,963.5 | 18,353.2 | 19,856.8 | 21,483.5 | 23,243.5 |
| Accounts Payable, % | 14.19 | 14.22 | 14.87 | 16.52 | 12.58 | 14.48 | 14.48 | 14.48 | 14.48 | 14.48 |
| Capital Expenditure | -1,420.0 | -1,320.0 | -1,820.0 | -1,530.0 | -1,610.0 | -1,903.6 | -2,059.5 | -2,228.2 | -2,410.8 | -2,608.3 |
| Capital Expenditure, % | -1.78 | -1.4 | -1.86 | -1.6 | -1.49 | -1.62 | -1.62 | -1.62 | -1.62 | -1.62 |
| Tax Rate, % | 23.02 | 23.02 | 23.02 | 23.02 | 23.02 | 23.02 | 23.02 | 23.02 | 23.02 | 23.02 |
| EBITAT | 11,997.0 | 12,548.4 | 13,438.3 | 15,360.5 | 15,096.7 | 16,881.4 | 18,264.4 | 19,760.7 | 21,379.5 | 23,130.9 |
| Depreciation | ||||||||||
| Changes in Account Receivables | ||||||||||
| Changes in Inventories | ||||||||||
| Changes in Accounts Payable | ||||||||||
| Capital Expenditure | ||||||||||
| UFCF | 8,097.0 | 9,198.4 | 11,788.3 | 14,690.5 | 13,096.7 | 18,595.4 | 17,441.9 | 18,870.8 | 20,416.7 | 22,089.3 |
| WACC, % | 4.67 | 4.67 | 4.67 | 4.67 | 4.67 | 4.67 | 4.67 | 4.67 | 4.67 | 4.67 |
| PV UFCF | ||||||||||
| SUM PV UFCF | 84,734.7 | |||||||||
| Long Term Growth Rate, % | 4.00 | |||||||||
| Free cash flow (T + 1) | 22,973 | |||||||||
| Terminal Value | 3,430,979 | |||||||||
| Present Terminal Value | 2,730,963 | |||||||||
| Enterprise Value | 2,815,698 | |||||||||
| Net Debt | -2,230 | |||||||||
| Equity Value | 2,817,928 | |||||||||
| Diluted Shares Outstanding, MM | 1,297 | |||||||||
| Equity Value Per Share | 2,172.69 |
What You Will Receive
- Flexible Forecast Inputs: Effortlessly adjust key assumptions (growth %, margins, WACC) to explore various scenarios.
- Real-World Insights: Marico Limited’s financial data is pre-loaded to enhance your analysis.
- Automated DCF Outputs: The template automatically computes Net Present Value (NPV) and intrinsic value for your convenience.
- Customizable and Professional Design: A sleek Excel model tailored to meet your valuation requirements.
- Designed for Analysts and Investors: Perfect for assessing projections, validating strategies, and optimizing your time.
Key Features
- Accurate MARICONS Data: Comes pre-loaded with Marico Limited's historical financial figures and forecasts.
- Flexible Input Options: Tailor revenue growth, profit margins, WACC, tax rates, and capital expenditures according to your needs.
- Advanced Valuation Model: Automatically refreshes the Net Present Value (NPV) and intrinsic value based on your customized inputs.
- Scenario Analysis: Generate various forecasting scenarios to evaluate different valuation results.
- Intuitive Interface: Designed to be straightforward and accessible for both experienced users and newcomers.
How It Functions
- Download the Template: Gain immediate access to the Excel-based Marico Limited (MARICONS) DCF Calculator.
- Enter Your Assumptions: Modify the yellow-highlighted cells for growth rates, WACC, profit margins, and other variables.
- Automatic Calculations: The model will instantly refresh Marico’s intrinsic value based on your inputs.
- Explore Scenarios: Run simulations with varying assumptions to assess potential changes in valuation.
- Evaluate and Decide: Leverage the insights gained to inform your investment or financial decision-making.
Why Choose the Marico Limited (MARICONS) Calculator?
- Time-Efficient: Skip the hassle of building a DCF model from the ground up – it's ready for immediate use.
- Enhanced Precision: Dependable financial data and formulas minimize valuation errors.
- Completely Customizable: Adjust the model to suit your unique assumptions and forecasts.
- User-Friendly: Intuitive charts and outputs simplify result analysis.
- Endorsed by Professionals: Created for experts who prioritize accuracy and functionality.
Who Should Benefit from This Product?
- Investors: Accurately assess Marico Limited’s (MARICONS) fair value prior to making investment choices.
- CFOs: Utilize a high-quality DCF model for financial reporting and analysis related to Marico Limited (MARICONS).
- Consultants: Effortlessly customize the template for valuation reports tailored to Marico Limited (MARICONS) clients.
- Entrepreneurs: Discover financial modeling strategies employed by leading firms like Marico Limited (MARICONS).
- Educators: Employ this as a teaching resource to illustrate various valuation techniques using Marico Limited (MARICONS) as a case study.
Contents of the Template
- Operating and Balance Sheet Data: Pre-filled historical data and forecasts for Marico Limited (MARICONS), including revenue, EBITDA, EBIT, and capital expenditures.
- WACC Calculation: A dedicated sheet for Weighted Average Cost of Capital (WACC), featuring parameters such as Beta, risk-free rate, and share price.
- DCF Valuation (Unlevered and Levered): Customizable Discounted Cash Flow models that display intrinsic value along with comprehensive calculations.
- Financial Statements: Pre-loaded financial statements (annual and quarterly) to enhance analysis.
- Key Ratios: A collection of profitability, leverage, and efficiency ratios specific to Marico Limited (MARICONS).
- Dashboard and Charts: Visual summaries of valuation outputs and assumptions for straightforward result analysis.
Disclaimer
All information, articles, and product details provided on this website are for general informational and educational purposes only. We do not claim any ownership over, nor do we intend to infringe upon, any trademarks, copyrights, logos, brand names, or other intellectual property mentioned or depicted on this site. Such intellectual property remains the property of its respective owners, and any references here are made solely for identification or informational purposes, without implying any affiliation, endorsement, or partnership.
We make no representations or warranties, express or implied, regarding the accuracy, completeness, or suitability of any content or products presented. Nothing on this website should be construed as legal, tax, investment, financial, medical, or other professional advice. In addition, no part of this site—including articles or product references—constitutes a solicitation, recommendation, endorsement, advertisement, or offer to buy or sell any securities, franchises, or other financial instruments, particularly in jurisdictions where such activity would be unlawful.
All content is of a general nature and may not address the specific circumstances of any individual or entity. It is not a substitute for professional advice or services. Any actions you take based on the information provided here are strictly at your own risk. You accept full responsibility for any decisions or outcomes arising from your use of this website and agree to release us from any liability in connection with your use of, or reliance upon, the content or products found herein.