
|
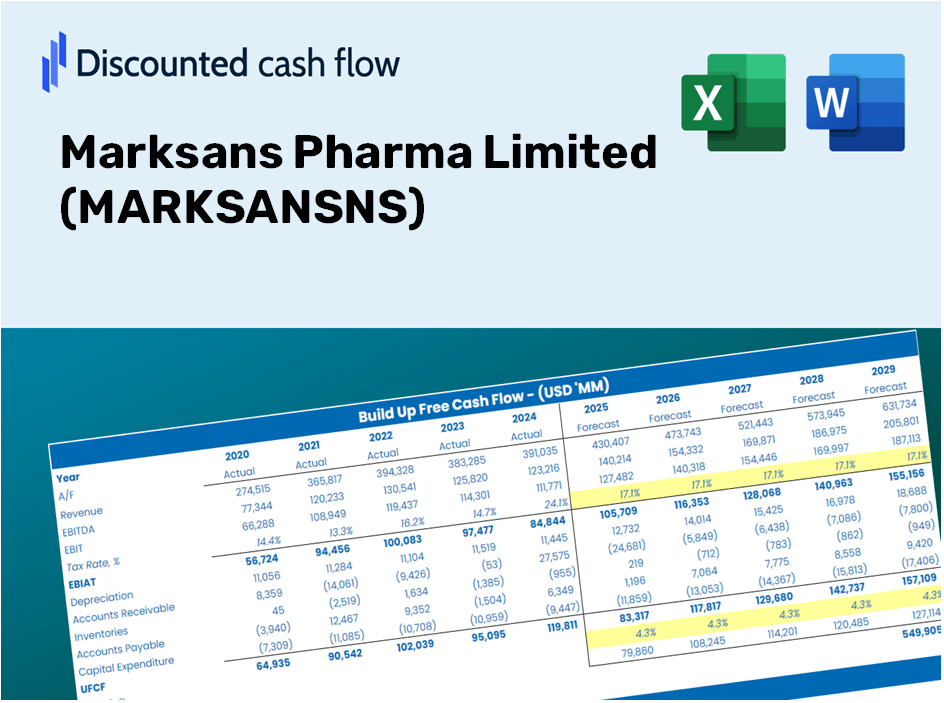
Marksans Pharma Limited (MARKSANS.NS) DCF Valuation
IN | Healthcare | Drug Manufacturers - General | NSE
|
- ✓ Fully Editable: Tailor To Your Needs In Excel Or Sheets
- ✓ Professional Design: Trusted, Industry-Standard Templates
- ✓ Pre-Built For Quick And Efficient Use
- ✓ No Expertise Is Needed; Easy To Follow
Marksans Pharma Limited (MARKSANS.NS) Bundle
Enhance your investment choices with the (MARKSANSNS) DCF Calculator! Explore genuine financial data for Marksans Pharma Limited, adjust growth projections and expenses, and instantly observe how these adjustments affect the intrinsic value of (MARKSANSNS).
Discounted Cash Flow (DCF) - (USD MM)
| Year | AY1 2019 |
AY2 2020 |
AY3 2021 |
AY4 2022 |
AY5 2023 |
FY1 2024 |
FY2 2025 |
FY3 2026 |
FY4 2027 |
FY5 2028 |
|---|---|---|---|---|---|---|---|---|---|---|
| Revenue | 11,293.3 | 13,683.7 | 14,801.2 | 18,521.4 | 21,774.1 | 25,695.0 | 30,321.9 | 35,782.0 | 42,225.4 | 49,829.0 |
| Revenue Growth, % | 0 | 21.17 | 8.17 | 25.13 | 17.56 | 18.01 | 18.01 | 18.01 | 18.01 | 18.01 |
| EBITDA | 1,925.8 | 3,463.0 | 3,007.3 | 3,986.3 | 5,090.0 | 5,528.4 | 6,523.9 | 7,698.7 | 9,085.0 | 10,720.9 |
| EBITDA, % | 17.05 | 25.31 | 20.32 | 21.52 | 23.38 | 21.52 | 21.52 | 21.52 | 21.52 | 21.52 |
| Depreciation | 266.6 | 361.5 | 447.8 | 518.5 | 742.7 | 731.7 | 863.5 | 1,019.0 | 1,202.4 | 1,419.0 |
| Depreciation, % | 2.36 | 2.64 | 3.03 | 2.8 | 3.41 | 2.85 | 2.85 | 2.85 | 2.85 | 2.85 |
| EBIT | 1,659.2 | 3,101.5 | 2,559.6 | 3,467.8 | 4,347.3 | 4,796.7 | 5,660.4 | 6,679.7 | 7,882.5 | 9,302.0 |
| EBIT, % | 14.69 | 22.67 | 17.29 | 18.72 | 19.97 | 18.67 | 18.67 | 18.67 | 18.67 | 18.67 |
| Total Cash | 931.2 | 2,093.8 | 3,466.9 | 7,191.6 | 7,002.3 | 6,061.8 | 7,153.4 | 8,441.5 | 9,961.6 | 11,755.4 |
| Total Cash, percent | .0 | .0 | .0 | .0 | .0 | .0 | .0 | .0 | .0 | .0 |
| Account Receivables | 2,433.5 | 2,719.5 | 3,947.8 | -40.7 | 4,531.8 | 4,557.6 | 5,378.3 | 6,346.8 | 7,489.7 | 8,838.4 |
| Account Receivables, % | 21.55 | 19.87 | 26.67 | -0.21991 | 20.81 | 17.74 | 17.74 | 17.74 | 17.74 | 17.74 |
| Inventories | 2,418.4 | 4,043.2 | 4,244.4 | 4,847.4 | 6,179.4 | 6,896.0 | 8,137.8 | 9,603.2 | 11,332.4 | 13,373.1 |
| Inventories, % | 21.41 | 29.55 | 28.68 | 26.17 | 28.38 | 26.84 | 26.84 | 26.84 | 26.84 | 26.84 |
| Accounts Payable | 1,103.3 | 1,686.6 | 2,000.8 | 2,306.0 | 2,682.8 | 3,103.2 | 3,661.9 | 4,321.4 | 5,099.5 | 6,017.8 |
| Accounts Payable, % | 9.77 | 12.33 | 13.52 | 12.45 | 12.32 | 12.08 | 12.08 | 12.08 | 12.08 | 12.08 |
| Capital Expenditure | -596.3 | -464.2 | -463.3 | -536.3 | -2,088.4 | -1,248.2 | -1,473.0 | -1,738.2 | -2,051.3 | -2,420.6 |
| Capital Expenditure, % | -5.28 | -3.39 | -3.13 | -2.9 | -9.59 | -4.86 | -4.86 | -4.86 | -4.86 | -4.86 |
| Tax Rate, % | 25.93 | 25.93 | 25.93 | 25.93 | 25.93 | 25.93 | 25.93 | 25.93 | 25.93 | 25.93 |
| EBITAT | 1,274.7 | 2,448.4 | 1,908.7 | 2,735.1 | 3,220.0 | 3,677.0 | 4,339.1 | 5,120.4 | 6,042.5 | 7,130.5 |
| Depreciation | ||||||||||
| Changes in Account Receivables | ||||||||||
| Changes in Inventories | ||||||||||
| Changes in Accounts Payable | ||||||||||
| Capital Expenditure | ||||||||||
| UFCF | -2,803.6 | 1,018.3 | 777.8 | 6,408.1 | -3,653.5 | 2,838.4 | 2,225.9 | 2,626.7 | 3,099.7 | 3,657.8 |
| WACC, % | 11.99 | 11.99 | 11.99 | 11.99 | 11.99 | 11.99 | 11.99 | 11.99 | 11.99 | 11.99 |
| PV UFCF | ||||||||||
| SUM PV UFCF | 10,226.4 | |||||||||
| Long Term Growth Rate, % | 3.50 | |||||||||
| Free cash flow (T + 1) | 3,786 | |||||||||
| Terminal Value | 44,591 | |||||||||
| Present Terminal Value | 25,313 | |||||||||
| Enterprise Value | 35,539 | |||||||||
| Net Debt | -1,592 | |||||||||
| Equity Value | 37,131 | |||||||||
| Diluted Shares Outstanding, MM | 453 | |||||||||
| Equity Value Per Share | 81.94 |
What You Will Receive
- Authentic MARKSANS Financial Data: Pre-loaded with historical and future projections for accurate analysis of Marksans Pharma Limited.
- Completely Customizable Template: Easily adjust key parameters such as revenue growth, WACC, and EBITDA percentage.
- Instantaneous Calculations: Observe real-time updates of Marksans’ intrinsic value based on your adjustments.
- Expert Valuation Tool: Crafted for investors, analysts, and consultants aiming for reliable DCF outcomes.
- Intuitive User Interface: Straightforward layout and clear guidance suitable for users at any skill level.
Key Features
- Comprehensive DCF Calculator: Features detailed unlevered and levered DCF valuation models tailored for Marksans Pharma Limited (MARKSANSNS).
- WACC Calculator: A pre-configured Weighted Average Cost of Capital template that allows for customizable inputs.
- Customizable Forecast Assumptions: Adjust growth rates, capital investments, and discount rates as needed.
- Integrated Financial Ratios: Evaluate profitability, leverage, and efficiency ratios specifically for Marksans Pharma Limited (MARKSANSNS).
- Visual Dashboard and Charts: Graphical representations provide a clear summary of essential valuation metrics for straightforward analysis.
How It Works
- Download the Template: Gain immediate access to the Excel-based MARKSANS DCF Calculator.
- Input Your Assumptions: Modify the yellow-highlighted cells for growth rates, WACC, margins, and additional variables.
- Instant Calculations: The model automatically recalculates the intrinsic value of Marksans Pharma Limited (MARKSANSNS).
- Test Scenarios: Experiment with various assumptions to assess potential changes in valuation.
- Analyze and Decide: Leverage the outcomes to inform your investment or financial analysis.
Why Opt for the MARKSANSNS Calculator?
- Time-Saving: Skip the hassle of building a DCF model from the ground up – it’s ready for immediate use.
- Enhanced Accuracy: Dependable financial data and precise formulas minimize valuation errors.
- Completely Customizable: Adjust the model to align with your own assumptions and forecasts.
- User-Friendly: Intuitive charts and outputs simplify the analysis of your results.
- Endorsed by Professionals: Crafted for experts who prioritize accuracy and ease of use.
Who Can Benefit from This Product?
- Pharmaceutical Students: Master valuation methods and apply them to real market data.
- Researchers: Integrate industry-standard models into your academic studies or projects.
- Investors: Validate your theories and assess valuation metrics for Marksans Pharma Limited (MARKSANSNS).
- Market Analysts: Enhance your efficiency with a ready-made, customizable DCF model.
- Entrepreneurs: Understand how major pharmaceutical firms like Marksans are evaluated in the market.
Contents of the Template
- Operating and Balance Sheet Data: Pre-filled historical data and forecasts for Marksans Pharma Limited (MARKSANSNS), including revenue, EBITDA, EBIT, and capital expenditures.
- WACC Calculation: A dedicated sheet for Weighted Average Cost of Capital (WACC), featuring parameters such as Beta, risk-free rate, and share price.
- DCF Valuation (Unlevered and Levered): Customizable Discounted Cash Flow models that display intrinsic value along with detailed calculations.
- Financial Statements: Pre-loaded annual and quarterly financial statements to facilitate thorough analysis.
- Key Ratios: Includes profitability, leverage, and efficiency ratios specific to Marksans Pharma Limited (MARKSANSNS).
- Dashboard and Charts: A visual overview of valuation results and assumptions for easy analysis of outcomes.
Disclaimer
All information, articles, and product details provided on this website are for general informational and educational purposes only. We do not claim any ownership over, nor do we intend to infringe upon, any trademarks, copyrights, logos, brand names, or other intellectual property mentioned or depicted on this site. Such intellectual property remains the property of its respective owners, and any references here are made solely for identification or informational purposes, without implying any affiliation, endorsement, or partnership.
We make no representations or warranties, express or implied, regarding the accuracy, completeness, or suitability of any content or products presented. Nothing on this website should be construed as legal, tax, investment, financial, medical, or other professional advice. In addition, no part of this site—including articles or product references—constitutes a solicitation, recommendation, endorsement, advertisement, or offer to buy or sell any securities, franchises, or other financial instruments, particularly in jurisdictions where such activity would be unlawful.
All content is of a general nature and may not address the specific circumstances of any individual or entity. It is not a substitute for professional advice or services. Any actions you take based on the information provided here are strictly at your own risk. You accept full responsibility for any decisions or outcomes arising from your use of this website and agree to release us from any liability in connection with your use of, or reliance upon, the content or products found herein.