
|
Maruti Suzuki India Limited (MARUTI.NS) DCF Valuation |
Fully Editable: Tailor To Your Needs In Excel Or Sheets
Professional Design: Trusted, Industry-Standard Templates
Investor-Approved Valuation Models
MAC/PC Compatible, Fully Unlocked
No Expertise Is Needed; Easy To Follow
Maruti Suzuki India Limited (MARUTI.NS) Bundle
Discover the true value of Maruti Suzuki India Limited (MARUTINS) with our advanced DCF Calculator! Adjust key assumptions, explore various scenarios, and evaluate how modifications affect the valuation of Maruti Suzuki India Limited (MARUTINS) – all within a single Excel template.
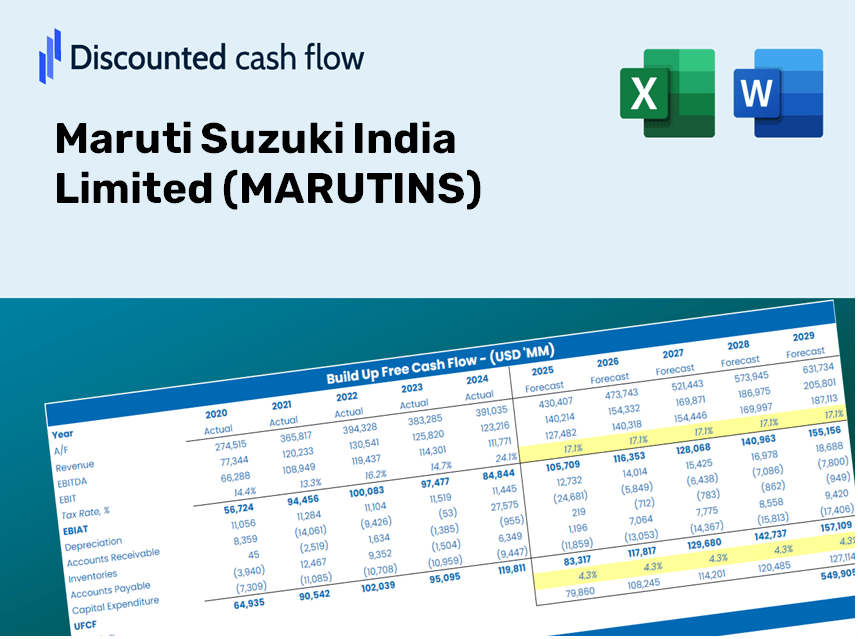
Discounted Cash Flow (DCF) - (USD MM)
| Year | AY1 2021 |
AY2 2022 |
AY3 2023 |
AY4 2024 |
AY5 2025 |
FY1 2026 |
FY2 2027 |
FY3 2028 |
FY4 2029 |
FY5 2030 |
|---|---|---|---|---|---|---|---|---|---|---|
| Revenue | 703,720.0 | 883,298.0 | 1,184,099.0 | 1,418,582.0 | 1,529,130.0 | 1,862,358.8 | 2,268,204.9 | 2,762,493.2 | 3,364,497.1 | 4,097,690.0 |
| Revenue Growth, % | 0 | 25.52 | 34.05 | 19.8 | 7.79 | 21.79 | 21.79 | 21.79 | 21.79 | 21.79 |
| EBITDA | 53,909.0 | 57,329.0 | 130,945.0 | 186,970.0 | 201,456.0 | 192,061.9 | 233,916.1 | 284,891.2 | 346,974.8 | 422,587.7 |
| EBITDA, % | 7.66 | 6.49 | 11.06 | 13.18 | 13.17 | 10.31 | 10.31 | 10.31 | 10.31 | 10.31 |
| Depreciation | 30,144.0 | 27,699.0 | 48,190.0 | 52,148.0 | 55,302.0 | 69,956.8 | 85,201.8 | 103,769.1 | 126,382.5 | 153,923.8 |
| Depreciation, % | 4.28 | 3.14 | 4.07 | 3.68 | 3.62 | 3.76 | 3.76 | 3.76 | 3.76 | 3.76 |
| EBIT | 23,765.0 | 29,630.0 | 82,755.0 | 134,822.0 | 146,154.0 | 122,105.1 | 148,714.3 | 181,122.1 | 220,592.4 | 268,664.0 |
| EBIT, % | 3.38 | 3.35 | 6.99 | 9.5 | 9.56 | 6.56 | 6.56 | 6.56 | 6.56 | 6.56 |
| Total Cash | 114,906.0 | 71,805.0 | 41,536.0 | 91,996.0 | 122,394.0 | 158,131.4 | 192,591.5 | 234,561.1 | 285,676.8 | 347,931.6 |
| Total Cash, percent | .0 | .0 | .0 | .0 | .0 | .0 | .0 | .0 | .0 | .0 |
| Account Receivables | 25,655.0 | 46,148.0 | 45,749.0 | 56,491.0 | 65,829.0 | 78,297.1 | 95,359.7 | 116,140.5 | 141,449.9 | 172,274.8 |
| Account Receivables, % | 3.65 | 5.22 | 3.86 | 3.98 | 4.3 | 4.2 | 4.2 | 4.2 | 4.2 | 4.2 |
| Inventories | 30,490.0 | 35,323.0 | 54,435.0 | 53,181.0 | 69,132.0 | 78,959.3 | 96,166.1 | 117,122.7 | 142,646.1 | 173,731.7 |
| Inventories, % | 4.33 | 4 | 4.6 | 3.75 | 4.52 | 4.24 | 4.24 | 4.24 | 4.24 | 4.24 |
| Accounts Payable | 101,681.0 | 97,652.0 | 136,755.0 | 169,884.0 | 205,015.0 | 232,558.9 | 283,238.3 | 344,961.7 | 420,135.9 | 511,692.2 |
| Accounts Payable, % | 14.45 | 11.06 | 11.55 | 11.98 | 13.41 | 12.49 | 12.49 | 12.49 | 12.49 | 12.49 |
| Capital Expenditure | -23,703.0 | -34,593.0 | -63,473.0 | -91,999.0 | -106,406.0 | -97,173.8 | -118,350.0 | -144,140.9 | -175,552.1 | -213,808.5 |
| Capital Expenditure, % | -3.37 | -3.92 | -5.36 | -6.49 | -6.96 | -5.22 | -5.22 | -5.22 | -5.22 | -5.22 |
| Tax Rate, % | 26.09 | 26.09 | 26.09 | 26.09 | 26.09 | 26.09 | 26.09 | 26.09 | 26.09 | 26.09 |
| EBITAT | 19,602.9 | 24,471.9 | 65,515.4 | 104,364.9 | 108,015.4 | 96,599.9 | 117,651.0 | 143,289.6 | 174,515.3 | 212,545.7 |
| Depreciation | ||||||||||
| Changes in Account Receivables | ||||||||||
| Changes in Inventories | ||||||||||
| Changes in Accounts Payable | ||||||||||
| Capital Expenditure | ||||||||||
| UFCF | 71,579.9 | -11,777.1 | 70,622.4 | 88,154.9 | 66,753.4 | 74,631.4 | 100,912.8 | 122,903.8 | 149,687.0 | 182,306.9 |
| WACC, % | 4.83 | 4.83 | 4.83 | 4.83 | 4.82 | 4.83 | 4.83 | 4.83 | 4.83 | 4.83 |
| PV UFCF | ||||||||||
| SUM PV UFCF | 537,736.1 | |||||||||
| Long Term Growth Rate, % | 4.00 | |||||||||
| Free cash flow (T + 1) | 189,599 | |||||||||
| Terminal Value | 22,966,957 | |||||||||
| Present Terminal Value | 18,145,466 | |||||||||
| Enterprise Value | 18,683,202 | |||||||||
| Net Debt | -975 | |||||||||
| Equity Value | 18,684,177 | |||||||||
| Diluted Shares Outstanding, MM | 314 | |||||||||
| Equity Value Per Share | 59,427.66 |
What You Will Receive
- Pre-Filled Financial Model: Utilize Maruti Suzuki's actual data for accurate DCF valuation.
- Comprehensive Forecast Control: Modify revenue growth, profit margins, WACC, and other essential parameters.
- Immediate Calculations: Real-time updates allow you to see the impact of your adjustments instantly.
- Investor-Ready Template: A polished Excel file crafted for high-standard valuation purposes.
- Customizable and Reusable: Designed for adaptability, enabling repeated use for extensive forecasting.
Key Features
- Comprehensive DCF Calculator: Features both unlevered and levered DCF valuation models tailored for Maruti Suzuki India Limited (MARUTINS).
- WACC Calculator: Pre-configured Weighted Average Cost of Capital sheet with adjustable inputs specific to MARUTINS.
- Customizable Forecast Assumptions: Easily adjust growth rates, capital expenditure plans, and discount rates for accurate projections.
- Integrated Financial Ratios: Assess profitability, leverage, and efficiency ratios specifically for Maruti Suzuki India Limited (MARUTINS).
- Interactive Dashboard and Charts: Visual representations of key valuation metrics for streamlined analysis of MARUTINS.
How It Functions
- Step 1: Download the Excel spreadsheet.
- Step 2: Examine the pre-filled Maruti Suzuki data (historical and forecasted).
- Step 3: Modify key assumptions (highlighted in yellow) according to your analysis.
- Step 4: Observe the automatic recalculations for Maruti Suzuki’s intrinsic value.
- Step 5: Utilize the results for investment strategies or reporting.
Why Choose This Calculator for Maruti Suzuki India Limited (MARUTINS)?
- User-Friendly Interface: Perfect for both newcomers and seasoned professionals.
- Customizable Variables: Tailor inputs to suit your specific financial analysis.
- Real-Time Adjustments: Observe immediate modifications to Maruti Suzuki's valuation as you tweak inputs.
- Pre-Configured Data: Comes equipped with Maruti Suzuki's actual financial metrics for swift evaluations.
- Relied Upon by Experts: A go-to resource for investors and analysts making strategic decisions.
Who Can Benefit from This Product?
- Individual Investors: Gain insights to make well-informed decisions on buying or selling Maruti Suzuki shares (MARUTINS).
- Financial Analysts: Enhance valuation processes with comprehensive financial models tailored for Maruti Suzuki (MARUTINS).
- Consultants: Provide clients with precise and professional valuation insights related to Maruti Suzuki (MARUTINS).
- Business Owners: Learn about the valuation methods of major companies like Maruti Suzuki (MARUTINS) to inform your own strategies.
- Finance Students: Acquire practical knowledge of valuation techniques using real-time data and case studies on Maruti Suzuki (MARUTINS).
Contents of the Template
- Detailed DCF Model: An editable template featuring comprehensive valuation computations.
- Real-Time Data: Maruti Suzuki’s historical and projected financials pre-loaded for in-depth analysis.
- Customizable Assumptions: Modify WACC, growth rates, and tax estimates to explore various scenarios.
- Financial Statements: Complete annual and quarterly reports for enhanced understanding.
- Key Financial Ratios: Integrated analysis covering profitability, efficiency, and leverage metrics.
- Interactive Dashboard: Visualizations and tables delivering clear, actionable insights.
Disclaimer
All information, articles, and product details provided on this website are for general informational and educational purposes only. We do not claim any ownership over, nor do we intend to infringe upon, any trademarks, copyrights, logos, brand names, or other intellectual property mentioned or depicted on this site. Such intellectual property remains the property of its respective owners, and any references here are made solely for identification or informational purposes, without implying any affiliation, endorsement, or partnership.
We make no representations or warranties, express or implied, regarding the accuracy, completeness, or suitability of any content or products presented. Nothing on this website should be construed as legal, tax, investment, financial, medical, or other professional advice. In addition, no part of this site—including articles or product references—constitutes a solicitation, recommendation, endorsement, advertisement, or offer to buy or sell any securities, franchises, or other financial instruments, particularly in jurisdictions where such activity would be unlawful.
All content is of a general nature and may not address the specific circumstances of any individual or entity. It is not a substitute for professional advice or services. Any actions you take based on the information provided here are strictly at your own risk. You accept full responsibility for any decisions or outcomes arising from your use of this website and agree to release us from any liability in connection with your use of, or reliance upon, the content or products found herein.