
|
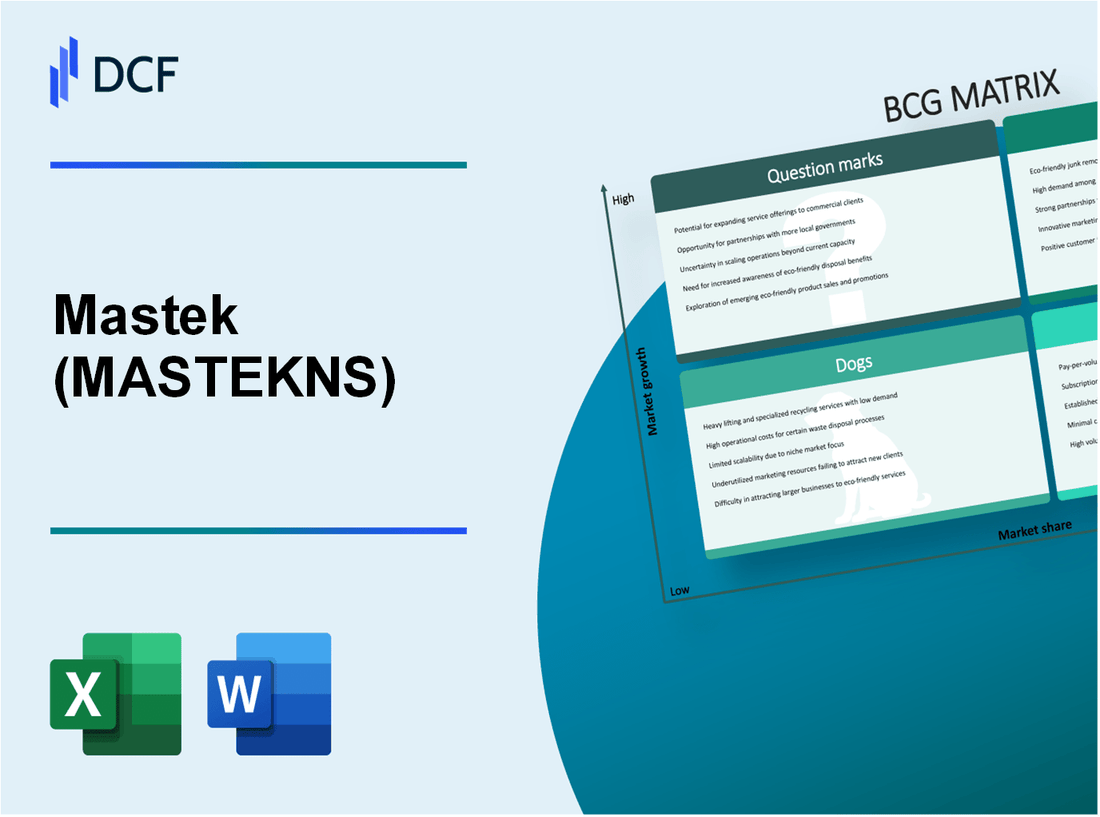
Mastek Limited (MASTEK.NS): BCG Matrix [Apr-2026 Updated] |
Fully Editable: Tailor To Your Needs In Excel Or Sheets
Professional Design: Trusted, Industry-Standard Templates
Investor-Approved Valuation Models
MAC/PC Compatible, Fully Unlocked
No Expertise Is Needed; Easy To Follow
Mastek Limited (MASTEK.NS) Bundle
Mastek's portfolio pairs high-growth "stars" - led by US healthcare, Oracle cloud/Evosys, cloud-native engineering and data analytics - that are absorbing the bulk of strategic CAPEX and R&D, with mature UK and Middle East cash cows funding expansion; meanwhile capital-hungry question marks (generative AI, Southeast Asia, ESG, cybersecurity) require bold investment decisions and several legacy "dogs" are prime for harvest or divestment, making the company's allocation choices today decisive for its next phase of profitable scale.
Mastek Limited (MASTEK.NS) - BCG Matrix Analysis: Stars
US HEALTHCARE AND LIFE SCIENCES DIGITAL SERVICES is a Star for Mastek driven by high market growth and significant relative share in targeted contracts. Year-on-year revenue for this division increased 21.0% as of late 2025. The global digital healthcare market in which it operates is expanding at a compound annual growth rate (CAGR) of 14.2%. The United States contributes 29.0% of group revenue, and operating margins in the segment are 18.5% despite aggressive hiring of specialized domain experts. Mastek has allocated 12.0% of total capital expenditure (CapEx) to develop proprietary AI-driven clinical data platforms to sustain differentiation and future growth.
| Metric | Value | Comment |
|---|---|---|
| Y-o-Y Revenue Growth | 21.0% | Late 2025 reported increase |
| Market CAGR (Global Digital Healthcare) | 14.2% | Industry forecast |
| Contribution to Group Revenue (US) | 29.0% | Large-scale contracts with regional health providers |
| Operating Margin | 18.5% | High-value segment margin after hiring |
| CapEx Allocation (Proprietary AI Platforms) | 12.0% of total CapEx | AI-driven clinical data platforms |
Key operational and strategic characteristics of the US Healthcare and Life Sciences unit include:
- Large-scale digital engineering contracts with regional health providers across multiple states.
- Heavy investment in domain-specific talent pools and clinical data scientists.
- Proprietary AI clinical data platforms intended to deliver recurring SaaS-style revenue.
- Targeted margin preservation while scaling through service differentiation and automation.
ORACLE CLOUD TRANSFORMATION AND EVOSYS INTEGRATION represents a Star due to its dominant position within the Oracle mid-tier integrator ecosystem and strong revenue contribution. The unit holds an estimated 7.0% global market share among mid-tier Oracle integrators. Revenue from Oracle cloud services has grown at 16.0% annually, driven by legacy ERP migrations to Oracle Cloud. EBITDA margins stand at 19.5%. The unit supports clients across 40 countries and accounts for 34.0% of consolidated revenue. Management directs 10.0% of the annual investment budget toward expanding offshore delivery centers to optimize cost-to-serve.
| Metric | Value | Comment |
|---|---|---|
| Global Market Share (mid-tier Oracle integrators) | 7.0% | Estimated position among peers |
| Revenue Growth (Oracle Cloud Services) | 16.0% CAGR | Driven by ERP cloud migrations |
| EBITDA Margin | 19.5% | Operational efficiency and scale |
| Geographic Footprint | 40 countries | Global client base |
| Share of Consolidated Revenue | 34.0% | Largest single contributor |
| Investment to Offshore Expansion | 10.0% of annual investment budget | Optimize cost-to-serve |
Strategic enablers and risks for the Oracle Cloud and Evosys unit:
- Strength in Oracle ecosystem partnerships and certified practices.
- Scalability through standardized migration frameworks and reusable assets.
- Concentration risk if Oracle platform dynamics change or competitor consolidation occurs.
- Margin resilience supported by a mix of cloud transformation and managed services contracts.
DIGITAL ENGINEERING AND CLOUD NATIVE SOLUTIONS functions as a Star by aligning with the surging global cloud microservices market and driving sizeable service revenues. This segment generates 25.0% of Mastek's total service revenue. The global cloud microservices market is growing at 22.0% CAGR. Mastek reports a 24.0% return on investment (ROI) in this area through automated delivery frameworks and reusable code assets. Capital expenditure and reinvestment for this unit focus on cloud certifications and training, with 8.0% of revenue reinvested into workforce upskilling. Average deal size increased 15.0% over the past twelve months as clients commit to multi-year transformation programs.
| Metric | Value | Comment |
|---|---|---|
| Share of Total Service Revenue | 25.0% | Core modernization services |
| Market CAGR (Cloud Microservices) | 22.0% | High-growth market alignment |
| Return on Investment (ROI) | 24.0% | Automated frameworks & reusable assets |
| Reinvestment in Workforce Upskilling | 8.0% of revenue | Cloud certifications and training |
| Average Deal Size Growth (12 months) | 15.0% | Shift to multi-year transformation programs |
Operational focus areas and competitive advantages:
- Automated CI/CD pipelines and domain-specific microservices templates.
- Strong ROI through reuse of accelerators and intellectual property.
- Investment in continuous professional development to maintain certifications and technical depth.
- Higher deal velocity and increased contract tenure from platform-driven outcomes.
DATA AUTOMATION AND ADVANCED ANALYTICS SERVICES has emerged as a Star by securing a 5.0% share of the specialized digital engineering market in the UK and US. Market demand for data modernization is expanding at 19.0% annually. The division contributes 12.0% to overall group revenue and commands the highest billing rates within Mastek's portfolio. Operating margins are sustained at 20.0% due to the complexity and specialized nature of engagements. Mastek invests 14.0% of its R&D budget into data privacy and security frameworks to address evolving regulatory requirements and maintain client trust.
| Metric | Value | Comment |
|---|---|---|
| Market Share (Specialized Digital Engineering, UK & US) | 5.0% | Focused vertical share |
| Market CAGR (Data Modernization) | 19.0% | Enterprise demand for AI-ready platforms |
| Contribution to Group Revenue | 12.0% | Premium billing segment |
| Operating Margin | 20.0% | High-complexity consulting engagements |
| R&D Allocation (Data Privacy & Security) | 14.0% of R&D budget | Regulatory and compliance focus |
Key levers and considerations for the Data Automation unit:
- Premium pricing supported by specialized talent and proprietary methodologies.
- Investment in data governance, privacy-by-design frameworks, and compliance tooling.
- Opportunity to monetize IP via repeatable data modernization and AI-enablement offerings.
- Need to sustain talent pipeline and protect margins against subcontracting cost inflation.
Mastek Limited (MASTEK.NS) - BCG Matrix Analysis: Cash Cows
Cash Cows
UK PUBLIC SECTOR DIGITAL TRANSFORMATION SERVICES: Mastek holds a commanding market share in the UK government sector which accounts for 56% of its total annual revenue. This mature business unit operates in a market growing at a steady 6% per year providing highly predictable cash flows. EBITDA margins for this segment are the highest in the company at 22.5% due to long-standing relationships and efficient delivery models. Capital expenditure requirements are minimal at less than 3% of segment revenue as the infrastructure is already well-established. The return on investment for this unit exceeds 30%, enabling the company to fund strategic expansion initiatives, notably into North America.
| Metric | Value | Notes |
|---|---|---|
| Revenue Contribution (FY) | 56% | Percentage of total company revenue |
| Market Growth Rate | 6% p.a. | UK government digital services |
| EBITDA Margin | 22.5% | Highest segment margin |
| CapEx | <3% of segment revenue | Maintenance and incremental upgrades |
| Return on Investment | >30% | Used to finance expansion |
UK PRIVATE SECTOR RETAIL AND FINANCIAL SERVICES: This established segment contributes 15% of total group revenue and focuses on long-term managed services contracts. The market for retail digital services is mature with a growth rate of 5% reflecting business stability. Mastek maintains a consistent operating margin of 17% in this area by focusing on operational excellence and client retention. With a contract renewal rate of 95%, this unit requires minimal marketing spend or new capital investment. The steady cash flow generated by these accounts supports quarterly dividend payments and debt servicing obligations.
| Metric | Value | Notes |
|---|---|---|
| Revenue Contribution | 15% | Group revenue share |
| Market Growth Rate | 5% p.a. | Mature retail/financial digital services |
| Operating Margin | 17% | Driven by managed services |
| Contract Renewal Rate | 95% | Low client churn |
| CapEx & Marketing Spend | Minimal | Supports dividends and debt service |
ORACLE MANAGED SUPPORT SERVICES: The post-implementation support business for Oracle customers provides a recurring revenue stream representing 10% of total turnover. This market is characterized by low volatility and a steady annual growth rate of 4% across the existing client base. The segment delivers reliable margins of 18% by utilizing a global delivery model that balances onshore and offshore resources. Investment levels are kept low at 2% of revenue as the primary focus is on maintaining service level agreements and customer satisfaction. This unit serves as a critical source of liquidity with a high cash conversion ratio of 85%.
| Metric | Value | Notes |
|---|---|---|
| Revenue Contribution | 10% | Of total turnover |
| Market Growth Rate | 4% p.a. | Stable post-implementation demand |
| Segment Margin | 18% | Global delivery efficiency |
| CapEx | 2% of revenue | Maintenance-focused |
| Cash Conversion Ratio | 85% | High liquidity generation |
MIDDLE EAST GOVERNMENT AND ENTERPRISE SERVICES: The Middle East division has matured into a cash cow contributing 8% of total revenue with a focus on public sector efficiency. While the regional market is growing at 9%, Mastek has already captured a significant portion of available Oracle-led transformation projects. The segment generates healthy margins of 19% despite increasing competition from local and global IT service providers. Capital expenditure is limited to 4% of revenue as the company leverages its existing talent pool from the Evosys acquisition. This business unit provides a stable return on equity of 22% which reinforces the company's financial position.
| Metric | Value | Notes |
|---|---|---|
| Revenue Contribution | 8% | Group revenue share |
| Market Growth Rate | 9% p.a. | Regional government/enterprise demand |
| Segment Margin | 19% | Healthy despite competition |
| CapEx | 4% of revenue | Talent and delivery investments |
| Return on Equity | 22% | Stable profitability |
Aggregate cash cow profile (combined metrics):
| Combined Metric | UK Public Sector | UK Private Sector | Oracle Managed | Middle East | Combined |
|---|---|---|---|---|---|
| Revenue Contribution | 56% | 15% | 10% | 8% | 89% |
| Average Market Growth | 6% | 5% | 4% | 9% | 5.6% (weighted) |
| Average Margin | 22.5% EBITDA | 17% Operating | 18% Margin | 19% Margin | 19.6% (approx.) |
| Average CapEx | <3% | Minimal | 2% | 4% | ~3% of segment revenues |
| Cash Conversion | High | High | 85% | High | ~>80% (estimate) |
- Primary role: Generate steady free cash flow to fund growth initiatives, dividends, and debt reduction.
- Investment posture: Maintain low incremental CapEx, prioritize contract renewals and service quality.
- Risk considerations: Dependence on UK public sector concentration (56% of revenue) requires active client relationship management and diversification mitigation.
- Operational focus: Preserve margins via delivery efficiency, leverage offshore capabilities, and cross-sell higher-margin services.
Mastek Limited (MASTEK.NS) - BCG Matrix Analysis: Question Marks
This chapter examines the business units classified as 'Dogs' within Mastek's portfolio: units characterized by low relative market share and limited current returns, yet carrying varying strategic implications and resource commitments.
GENERIC SUMMARY TABLE OF DOGS SEGMENTS
| Business Unit | Market Growth Rate (CAGR) | Current Revenue Contribution (%) | Relative Market Share (%) | R&D / CAPEX Allocation | Operating Margin (%) | Current ROI | Key Strategic Notes |
|---|---|---|---|---|---|---|---|
| Generative AI and Co-pilot Implementation | 38% | 4% | <1% | 15% of total R&D budget | Negative (investment phase) | Negative | High potential, low share vs. global leaders; heavy talent & compute cost |
| Southeast Asia Digital Expansion | 15% | <3% | Negligible | 7% of total CAPEX (regional hub) | 10% | Low to breakeven | High setup costs; local competition constrains share |
| Sustainability & ESG Digital Reporting | 25% | 2% | Fragmented | 6% of unit revenue invested | Low (early-stage monetization) | Low | Niche regulatory-driven demand; differentiation challenges vs. boutiques |
| Cybersecurity & IAM Services | 13% | 5% | <2% | Evaluating 10% CAPEX vs. partner model | 14% | Moderate but capital-intensive | Offered mainly as add-ons; requires SOCs and certifications |
GENERATIVE AI AND CO-PILOT IMPLEMENTATION
The generative AI unit operates in a global market expanding at an estimated 38% CAGR through 2026. Mastek allocates 15% of its total R&D budget to build the ICX platform and AI-led delivery tools. Current revenue from this unit is approximately 4% of consolidated sales, while relative market share remains under 1%. Initial pilots are primarily with enterprise customers, but competition from hyperscalers and large consultancies limits new-logo wins.
Key quantitative attributes:
- Market CAGR: 38% (global)
- Revenue contribution: 4% of total
- Relative market share: <1%
- R&D allocation: 15% of total R&D spend (numeric equivalent: if R&D = INR X, allocation = 0.15X)
- Talent & compute cost burden: estimated incremental spend +20-30% on people/infra vs. typical delivery teams
- Current ROI: negative due to upfront hiring and cloud/GPUs
SOUTHEAST ASIA DIGITAL EXPANSION INITIATIVES
Southeast Asia expansion targets markets with digital spending growth near 15% annually. The region currently contributes less than 3% to Mastek's revenue. Mastek has committed 7% of total CAPEX to establish a regional delivery hub in Singapore. Operating margins in the region are approximately 10% at present, below company-average margins due to initial setup costs and localized marketing campaigns. Local incumbents and regional integrators constrain share gains.
Quantitative snapshot:
- Regional market growth: 15% CAGR
- Revenue share: <3% of consolidated revenue
- Market share: negligible (single-digit percentage points by country)
- CAPEX allocation: 7% of total CAPEX dedicated to regional hub
- Operating margin: ~10%
- Payback horizon: expected 3-5 years under moderate growth scenarios
SUSTAINABILITY AND ESG DIGITAL REPORTING SOLUTIONS
The ESG reporting service addresses regulatory-driven demand growing at roughly 25% annually. Mastek's ESG solutions contribute ~2% of total revenue, with the company investing roughly 6% of the unit's revenue back into developing proprietary carbon footprint tracking and reporting software. Market share is fragmented among boutique specialists and larger system integrators; differentiation remains a challenge. Current return on investment is low but the segment is strategically important for cross-selling into enterprise transformation programs.
Segment metrics:
- Market CAGR: 25%
- Revenue contribution: ~2%
- R&D/Investment: 6% of unit revenue
- Market structure: fragmented; many niche providers
- Current ROI: low; pilot-to-production conversion rates under 30% for new clients
- Average deal size: smaller initial tickets (estimated INR 2-10 million), upsell potential to larger transformation programs
CYBERSECURITY AND IDENTITY ACCESS MANAGEMENT SERVICES
Cybersecurity and IAM operate in a steady demand segment expanding at ~13% CAGR. Mastek's share is under 2%, and revenue contribution is about 5% of the company total. The business currently functions as an adjunct to cloud and application engagements rather than a standalone high-share practice. Operating margins are around 14%, reflecting the high recurring cost of maintaining 24/7 security operations and compliance certifications. Management is evaluating increased CAPEX investment (up to 10%) to build SOC capabilities or alternatively partnering with specialized vendors to reduce capital intensity.
Operational and financial datapoints:
- Market CAGR: 13%
- Revenue contribution: 5%
- Relative market share: <2%
- Operating margin: ~14%
- Investment options: 10% CAPEX to build SOC vs. partner model
- Required certifications and costs: ISO 27001, SOC2, MDR tooling-estimated initial capex INR Y plus annual OPEX uplift of 8-12% of current segment revenue
COMPARATIVE FINANCIAL SUMMARY
| Metric | Generative AI | SEA Expansion | ESG Reporting | Cybersecurity |
|---|---|---|---|---|
| Market CAGR | 38% | 15% | 25% | 13% |
| Revenue Contribution | 4% | <3% | 2% | 5% |
| Relative Market Share | <1% | Negligible | Fragmented | <2% |
| Investment Intensity | High (R&D heavy) | High (CAPEX heavy) | Moderate (product dev) | High (SOCs & certs) |
| Operating Margin | Negative | 10% | Low | 14% |
| Short-term ROI | Negative | Low/Breakeven horizon | Low | Moderate |
ACTIONABLE FOCUS AREAS (TACTICAL ITEMS)
- Re-assess R&D allocation to generative AI: align spend to validated pilots and payback timelines; track cost-per-pilot and conversion rate to production.
- De-risk SEA expansion: phase CAPEX deployment tied to KPIs (customer acquisition cost, local win-rate, margin recovery) and consider joint ventures with local players.
- Differentiate ESG offerings: accelerate IP development for carbon tracking, target regulated industries first, and bundle with advisory services to raise average deal size.
- Evaluate cybersecurity scale options: model CAPEX build vs. managed service partnerships with clear TCO, margin, and time-to-market scenarios.
Mastek Limited (MASTEK.NS) - BCG Matrix Analysis: Dogs
LEGACY MAINFRAME AND ON-PREMISE MAINTENANCE: This unit focuses on support for legacy mainframe environments and on-premise IT maintenance. Market demand is contracting at -5.0% CAGR as enterprise clients accelerate cloud migrations. Revenue from these services has declined from 7.2% to 4.0% of group revenue over the last three fiscal years. Current operating margin stands at 11.0% (down from 15.5% three years ago) as pricing pressure and commoditization compress profitability. Capital expenditure allocated to this unit has been reduced to INR 0.2 crore/year (effectively near zero) versus INR 15.0 crore three years prior. Low relative market share (<1.5% in target legacy segments) and limited strategic fit indicate high divestiture potential.
SMALL-SCALE EUROPEAN REGIONAL CONSULTING OPERATIONS: These micro-regional consulting arms in select European countries contribute 1.7% to group revenue and show flat to marginal growth of +0.5% LTM; local market growth is ~2.0% annually due to macroeconomic headwinds and constrained IT budgets. Operating margins have fallen to 9.0% with labor costs and overheads outpacing revenue gains. No CAPEX has been deployed for expansion in the past 24 months (CAPEX = INR 0 crore for the last two fiscal years). Return on invested capital (ROIC) for these operations is 3.2%, materially below the consolidated ROIC of 12.4%, making them a low-priority area for the executive team.
CUSTOM LEGACY SOFTWARE DEVELOPMENT FOR NON-STRATEGIC SECTORS: This segment supports bespoke applications for industries outside Mastek's strategic focus. Market size is contracting at -3.0% annually as standardized SaaS penetration increases. The segment contributes 3.0% of group revenue with estimated relative market share <2.0% versus specialized offshore vendors. Margins are ~12.0% today but forecasted to decline to near 8-9% within three years as legacy-skilled labor diminishes and wage premia increase for scarce talent. The company is actively migrating clients to cloud-native platforms to transition revenue into higher-growth, higher-margin segments; migration pipeline conversion rate is currently 18% of legacy clients per annum.
HARDWARE RESELLING AND BASIC INFRASTRUCTURE PROVISIONING: Resale of third-party hardware and low-end infrastructure contributes ~1.0% of group revenue. The addressable market growth is negligible (~+1.0% annually) and gross margins are extremely thin at 5.0%. No product differentiation or supplier exclusivity exists; procurement volume discounts are insufficient to compete with large distributors. CAPEX allocation is zero and headcount allocated to this division is approximately 0.8% of total group employees. The segment increases administrative complexity (estimated incremental annual reporting and compliance cost: INR 1.5 crore) with minimal strategic upside.
| Business Unit | Revenue % of Group | Market Growth (YoY) | Relative Market Share | Operating Margin | CAPEX (INR crore / year) | ROIC |
|---|---|---|---|---|---|---|
| Legacy Mainframe & On-Premise Maintenance | 4.0% | -5.0% CAGR | <1.5% | 11.0% | 0.2 | 2.8% |
| Small-Scale European Regional Consulting | 1.7% | +2.0% local | ~1.0-1.2% | 9.0% | 0.0 | 3.2% |
| Custom Legacy Software (Non-Strategic) | 3.0% | -3.0% CAGR | <2.0% | 12.0% | 0.1 | 4.1% |
| Hardware Reselling & Basic Infrastructure | 1.0% | +1.0% market | ~0.8% | 5.0% | 0.0 | 1.5% |
Suggested tactical and portfolio-management actions:
- Accelerate harvesting strategy for legacy maintenance: reduce support headcount via attrition, increase fixed-price transition offers, preserve cash flow while exiting over 36 months.
- Assess sale or closure of small European operations: target divestiture or managed exit where buyers exist; otherwise consolidate back-office functions into UK hub to cut costs by estimated 40%.
- Push legacy-to-cloud migration program: prioritize customers with >INR 1 crore ARR, offer cloud migration credits, aim to convert 50% of high-value legacy accounts within 24 months.
- Terminate or outsource hardware resale activities: negotiate supplier exit terms, migrate existing customers to partner distribution channels to remove balance-sheet and working capital drag.
- Reallocate freed CAPEX and headcount to high-growth digital engineering and cloud-native product lines where projected ROI >20%.
Disclaimer
All information, articles, and product details provided on this website are for general informational and educational purposes only. We do not claim any ownership over, nor do we intend to infringe upon, any trademarks, copyrights, logos, brand names, or other intellectual property mentioned or depicted on this site. Such intellectual property remains the property of its respective owners, and any references here are made solely for identification or informational purposes, without implying any affiliation, endorsement, or partnership.
We make no representations or warranties, express or implied, regarding the accuracy, completeness, or suitability of any content or products presented. Nothing on this website should be construed as legal, tax, investment, financial, medical, or other professional advice. In addition, no part of this site—including articles or product references—constitutes a solicitation, recommendation, endorsement, advertisement, or offer to buy or sell any securities, franchises, or other financial instruments, particularly in jurisdictions where such activity would be unlawful.
All content is of a general nature and may not address the specific circumstances of any individual or entity. It is not a substitute for professional advice or services. Any actions you take based on the information provided here are strictly at your own risk. You accept full responsibility for any decisions or outcomes arising from your use of this website and agree to release us from any liability in connection with your use of, or reliance upon, the content or products found herein.