
|
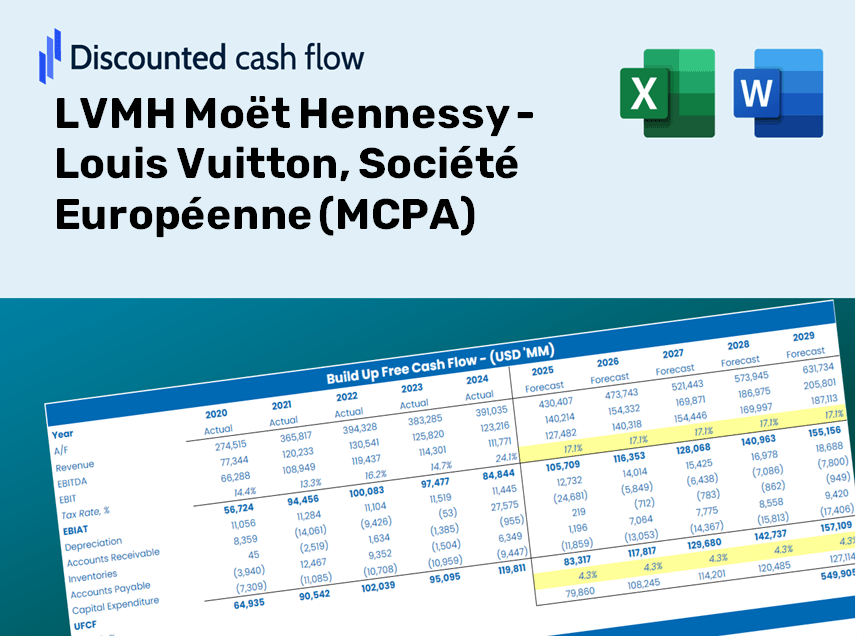
LVMH Moët Hennessy - Louis Vuitton, Société Européenne (MC.PA) DCF Valuation |
Fully Editable: Tailor To Your Needs In Excel Or Sheets
Professional Design: Trusted, Industry-Standard Templates
Investor-Approved Valuation Models
MAC/PC Compatible, Fully Unlocked
No Expertise Is Needed; Easy To Follow
LVMH Moët Hennessy - Louis Vuitton, Société Européenne (MC.PA) Bundle
Whether you’re an investor or analyst, this (LVMH) DCF Calculator is your ultimate tool for accurate valuation. Preloaded with LVMH Moët Hennessy - Louis Vuitton, Société Européenne real data, you can adjust forecasts and see the effects instantly.
Discounted Cash Flow (DCF) - (USD MM)
| Year | AY1 2020 |
AY2 2021 |
AY3 2022 |
AY4 2023 |
AY5 2024 |
FY1 2025 |
FY2 2026 |
FY3 2027 |
FY4 2028 |
FY5 2029 |
|---|---|---|---|---|---|---|---|---|---|---|
| Revenue | 44,651.0 | 64,215.0 | 79,184.0 | 86,153.0 | 84,683.0 | 100,396.1 | 119,024.8 | 141,110.2 | 167,293.5 | 198,335.1 |
| Revenue Growth, % | 0 | 43.82 | 23.31 | 8.8 | -1.71 | 18.56 | 18.56 | 18.56 | 18.56 | 18.56 |
| EBITDA | 12,535.0 | 22,494.0 | 26,068.0 | 28,551.0 | 22,295.0 | 31,221.3 | 37,014.5 | 43,882.6 | 52,025.2 | 61,678.6 |
| EBITDA, % | 28.07 | 35.03 | 32.92 | 33.14 | 26.33 | 31.1 | 31.1 | 31.1 | 31.1 | 31.1 |
| Depreciation | 4,763.0 | 5,057.0 | 5,610.0 | 5,960.0 | 3,228.0 | 7,300.2 | 8,654.7 | 10,260.6 | 12,164.5 | 14,421.7 |
| Depreciation, % | 10.67 | 7.88 | 7.08 | 6.92 | 3.81 | 7.27 | 7.27 | 7.27 | 7.27 | 7.27 |
| EBIT | 7,772.0 | 17,437.0 | 20,458.0 | 22,591.0 | 19,067.0 | 23,921.2 | 28,359.8 | 33,622.0 | 39,860.6 | 47,256.9 |
| EBIT, % | 17.41 | 27.15 | 25.84 | 26.22 | 22.52 | 23.83 | 23.83 | 23.83 | 23.83 | 23.83 |
| Total Cash | 20,715.0 | 10,565.0 | 10,852.0 | 11,264.0 | 13,587.0 | 21,217.6 | 25,154.6 | 29,822.1 | 35,355.6 | 41,915.9 |
| Total Cash, percent | .0 | .0 | .0 | .0 | .0 | .0 | .0 | .0 | .0 | .0 |
| Account Receivables | 4,678.0 | 6,112.0 | 7,108.0 | 4,728.0 | 5,762.0 | 8,285.4 | 9,822.8 | 11,645.4 | 13,806.2 | 16,368.0 |
| Account Receivables, % | 10.48 | 9.52 | 8.98 | 5.49 | 6.8 | 8.25 | 8.25 | 8.25 | 8.25 | 8.25 |
| Inventories | 13,225.0 | 16,864.0 | 20,705.0 | 22,952.0 | 23,669.0 | 27,432.1 | 32,522.2 | 38,556.8 | 45,711.1 | 54,192.9 |
| Inventories, % | 29.62 | 26.26 | 26.15 | 26.64 | 27.95 | 27.32 | 27.32 | 27.32 | 27.32 | 27.32 |
| Accounts Payable | 5,098.0 | 7,086.0 | 8,788.0 | 9,049.0 | 8,630.0 | 10,891.9 | 12,913.0 | 15,309.0 | 18,149.6 | 21,517.3 |
| Accounts Payable, % | 11.42 | 11.03 | 11.1 | 10.5 | 10.19 | 10.85 | 10.85 | 10.85 | 10.85 | 10.85 |
| Capital Expenditure | -2,465.0 | -3,255.0 | -5,082.0 | -7,807.0 | -5,552.0 | -6,550.9 | -7,766.5 | -9,207.6 | -10,916.1 | -12,941.6 |
| Capital Expenditure, % | -5.52 | -5.07 | -6.42 | -9.06 | -6.56 | -6.53 | -6.53 | -6.53 | -6.53 | -6.53 |
| Tax Rate, % | 30.72 | 30.72 | 30.72 | 30.72 | 30.72 | 30.72 | 30.72 | 30.72 | 30.72 | 30.72 |
| EBITAT | 4,962.5 | 12,205.4 | 14,325.6 | 15,851.8 | 13,209.5 | 16,425.3 | 19,473.0 | 23,086.3 | 27,370.0 | 32,448.6 |
| Depreciation | ||||||||||
| Changes in Account Receivables | ||||||||||
| Changes in Inventories | ||||||||||
| Changes in Accounts Payable | ||||||||||
| Capital Expenditure | ||||||||||
| UFCF | -5,544.5 | 10,922.4 | 11,718.6 | 14,398.8 | 8,715.5 | 13,149.9 | 15,754.8 | 18,678.2 | 22,144.0 | 26,252.8 |
| WACC, % | 7.67 | 7.7 | 7.7 | 7.7 | 7.7 | 7.69 | 7.69 | 7.69 | 7.69 | 7.69 |
| PV UFCF | ||||||||||
| SUM PV UFCF | 75,335.2 | |||||||||
| Long Term Growth Rate, % | 2.00 | |||||||||
| Free cash flow (T + 1) | 26,778 | |||||||||
| Terminal Value | 470,349 | |||||||||
| Present Terminal Value | 324,697 | |||||||||
| Enterprise Value | 400,033 | |||||||||
| Net Debt | 31,572 | |||||||||
| Equity Value | 368,461 | |||||||||
| Diluted Shares Outstanding, MM | 500 | |||||||||
| Equity Value Per Share | 737.39 |
What You Will Receive
- Adjustable Forecast Inputs: Effortlessly modify key assumptions (growth %, margins, WACC) to explore various scenarios.
- Comprehensive Financial Data: LVMH's financial metrics pre-loaded to facilitate your analysis.
- Automated DCF Calculations: The template computes Net Present Value (NPV) and intrinsic value automatically.
- Professional and Customizable: A refined Excel model tailored to meet your valuation requirements.
- Designed for Analysts and Investors: Perfect for evaluating projections, confirming strategies, and optimizing efficiency.
Key Features
- 🔍 Real-Life LVMH Financials: Pre-filled historical and projected data for LVMH Moët Hennessy - Louis Vuitton (MC.PA).
- ✏️ Fully Customizable Inputs: Adjust all critical parameters (yellow cells) such as WACC, growth %, and tax rates.
- 📊 Professional DCF Valuation: Built-in formulas calculate LVMH’s intrinsic value using the Discounted Cash Flow method.
- ⚡ Instant Results: Visualize LVMH’s valuation immediately after making adjustments.
- Scenario Analysis: Test and compare outcomes for diverse financial assumptions side-by-side.
How It Functions
- Download the Template: Gain immediate access to the Excel-based LVMH DCF Calculator.
- Input Your Assumptions: Modify the yellow-highlighted cells for growth rates, WACC, margins, and more.
- Instant Calculations: The model automatically refreshes LVMH's intrinsic value.
- Test Scenarios: Experiment with different assumptions to assess potential valuation shifts.
- Analyze and Decide: Utilize the results to inform your investment or financial assessments.
Why Choose This LVMH Calculator?
- Precision: Utilizes accurate financial data from LVMH (MC.PA) for reliable results.
- Adaptability: Crafted for users to freely experiment with and adjust inputs.
- Efficiency: Avoid the complexities of constructing a discounted cash flow model from the ground up.
- Professional Quality: Built with the expertise and usability considerations of top financial executives.
- User-Centric: Intuitive interface makes it accessible for all users, regardless of financial modeling skills.
Who Can Benefit from This Product?
- Institutional Investors: Create in-depth and trustworthy valuation models for asset management analysis related to LVMH Moët Hennessy - Louis Vuitton (LVMH).
- Corporate Finance Departments: Evaluate valuation scenarios to inform and shape strategic decisions within their organizations.
- Financial Consultants and Advisors: Deliver precise valuation insights and recommendations for clients interested in LVMH (LVMH) stock.
- Academics and Students: Utilize real-world financial data to enhance learning and practice financial modeling techniques.
- Luxury Brand Enthusiasts: Gain insights into how high-end brands like LVMH (LVMH) are valued in the competitive market landscape.
What the LVMH Template Includes
- Comprehensive DCF Model: An editable template featuring thorough valuation calculations.
- Real-World Data: Historical and projected financial data for LVMH (MCAP) preloaded for analysis.
- Customizable Parameters: Modify WACC, growth rates, and tax assumptions to explore different scenarios.
- Financial Statements: Complete annual and quarterly breakdowns for enhanced insights.
- Key Ratios: Integrated analysis of profitability, efficiency, and leverage metrics.
- Dashboard with Visual Outputs: Visual representations through charts and tables for clear, actionable results.
Disclaimer
All information, articles, and product details provided on this website are for general informational and educational purposes only. We do not claim any ownership over, nor do we intend to infringe upon, any trademarks, copyrights, logos, brand names, or other intellectual property mentioned or depicted on this site. Such intellectual property remains the property of its respective owners, and any references here are made solely for identification or informational purposes, without implying any affiliation, endorsement, or partnership.
We make no representations or warranties, express or implied, regarding the accuracy, completeness, or suitability of any content or products presented. Nothing on this website should be construed as legal, tax, investment, financial, medical, or other professional advice. In addition, no part of this site—including articles or product references—constitutes a solicitation, recommendation, endorsement, advertisement, or offer to buy or sell any securities, franchises, or other financial instruments, particularly in jurisdictions where such activity would be unlawful.
All content is of a general nature and may not address the specific circumstances of any individual or entity. It is not a substitute for professional advice or services. Any actions you take based on the information provided here are strictly at your own risk. You accept full responsibility for any decisions or outcomes arising from your use of this website and agree to release us from any liability in connection with your use of, or reliance upon, the content or products found herein.