
|
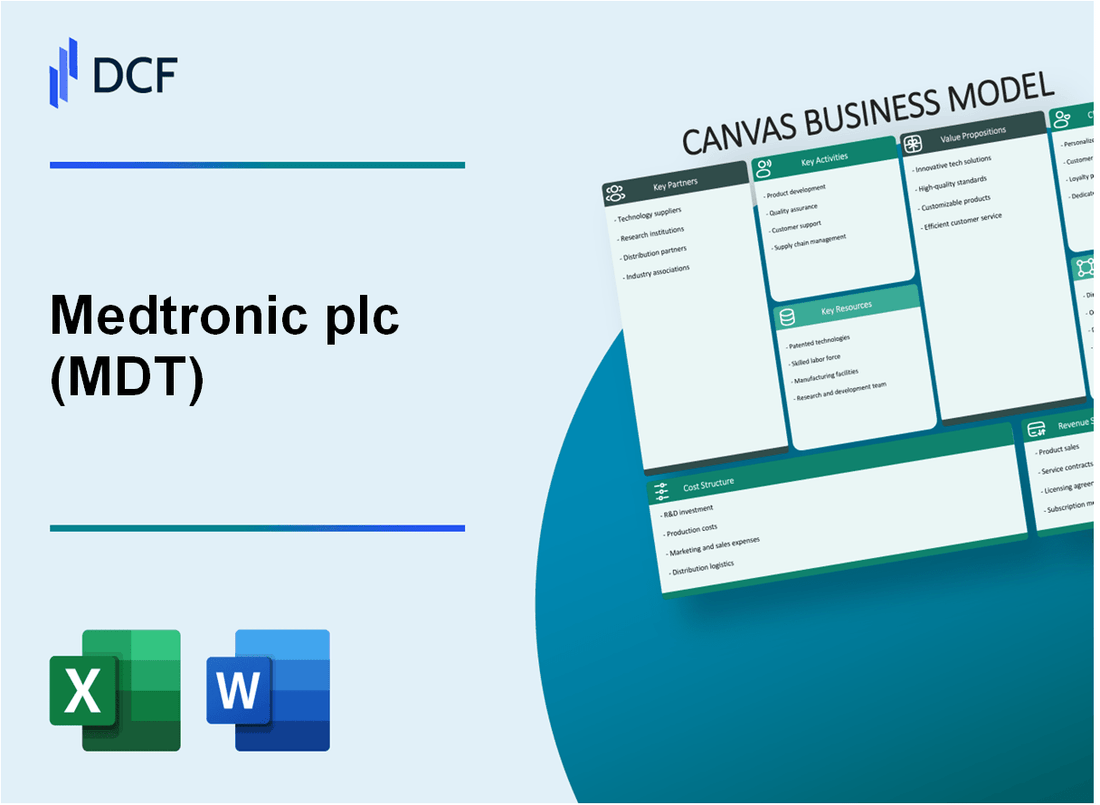
Medtronic plc (MDT): Business Model Canvas [Dec-2025 Updated] |
Fully Editable: Tailor To Your Needs In Excel Or Sheets
Professional Design: Trusted, Industry-Standard Templates
Investor-Approved Valuation Models
MAC/PC Compatible, Fully Unlocked
No Expertise Is Needed; Easy To Follow
Medtronic plc (MDT) Bundle
You're digging into the mechanics of Medtronic plc's business model as of late 2025, and honestly, the numbers from Fiscal Year 2025 paint a clear picture of a massive medical device player managing a strategic pivot. With total worldwide revenue hitting $33.537 billion last year, driven heavily by its Cardiovascular segment at $12.481 billion, the core challenge is balancing heavy investment-like the $2.732 billion poured into R&D-against the operational costs of a global footprint. To see exactly how this giant, which serves over 79 million patients annually, structures its value creation, from its IP portfolio to its complex B2B sales channels, look no further than the nine building blocks detailed below.
Medtronic plc (MDT) - Canvas Business Model: Key Partnerships
You're looking at the backbone of Medtronic plc's global reach and innovation engine-the Key Partnerships block. Honestly, a company this size doesn't just build everything in-house; it relies on a web of strategic alliances to get its technology to the 79M+ patients it served in fiscal year 2025.
Strategic Alliances for Technology Integration and Market Access
Medtronic plc actively partners to embed its technology within broader healthcare ecosystems, which is crucial for scaling solutions beyond just the device itself. This is where you see the real-world application of their innovation strategy.
- Strategic collaboration with Philips to expand access to patient monitoring technology, building on a history dating back to 1992.
- Partnership with Methinks AI, announced in March 2025, to enhance stroke treatment across EMEA, Africa, Türkiye, and the Middle East, supporting the Neurovascular business.
- Collaboration with Siemens Healthineers on the AiBLE surgical ecosystem, positioning both giants in the advanced AI-driven surgical space.
The Methinks AI deal, while not disclosing financial terms, integrates a solution validated to detect over 80% of large vessel occlusions using only non-contrast CT imaging, directly impacting the time-to-treatment metric for acute ischemic stroke. For the Philips monitoring collaboration, Medtronic's market-leading technologies like Nellcor™ pulse oximetry, Microstream™ capnography, and BIS™ brain monitoring are integrated into Philips' systems.
Research and Development Collaborations
To fuel its pipeline, Medtronic plc maintains deep ties with the academic and research community. This is how they keep the innovation engine running hot, supported by significant capital allocation.
Medtronic plc invested $2.7 billion in Research and Development in fiscal year 2025, which represented approximately 8% of its non-GAAP revenue for that year. This investment supports their commitment to continuous product iteration and technological advancement. The company maintained over 170 Active Clinical Trials in FY25.
| Academic Partner Type | Reported Activity Context (FY2025) | Financial Metric Context |
| Academic Institutions (e.g., University of Minnesota) | Conduct research, seek patent protection, and establish collaborative arrangements for discovery and clinical development. | R&D Investment: $2.7 billion in FY2025. |
| Governmental Agencies | Collaborative arrangements for product development and marketing. | Operating Cash Flow: $7.044 billion in FY2025. |
| Other Public/Private Research Organizations | Seek product technologies similar to those of Medtronic plc. | FY2025 Reported Revenue: $33.537 billion. |
These partnerships help keep Medtronic plc focused on patient needs throughout the innovation and healthcare delivery processes.
Global Supply Chain and Supplier Management
Managing a global supply chain that supports over 150 countries is a massive undertaking, especially given the material cost pressures seen in the industry. You have to manage the raw inputs to deliver the final product.
As of early 2024, Medtronic plc was actively streamlining its supplier base, planning to cut around 200 suppliers from a total base of approximately 65,000 suppliers spread across 134 countries. This consolidation focuses on strategic suppliers capable of providing high quality and continuous improvement. The company spent nearly $11 billion on cost of goods sold in the year prior to March 2024.
- Supplier base reduction target: Cutting approximately 200 suppliers.
- Total historical supplier count: Approximately 65,000.
- Geographic spread of suppliers: 134 countries.
- Cost of Goods Sold (Pre-FY2024): Nearly $11 billion.
The goal of this optimization is to drive cost efficiency and reduce working capital levels. For context on efficiency gains possible through supply chain management, one case study showed Integrated Health Solutions reducing materials management running costs by 77% over two years at a specific hospital department.
Finance: draft 13-week cash view by Friday.
Medtronic plc (MDT) - Canvas Business Model: Key Activities
You're looking at the core engine of Medtronic plc's business model, the things they absolutely must do well to keep the revenue flowing and the innovation pipeline full. Honestly, for a company this size, these activities are massive undertakings.
Extensive R&D and Product Innovation
The commitment to research and development is central. Medtronic plc invested $2.732B in Research & Development expenses for fiscal year 2025 (FY25). This investment supports a robust pipeline, as evidenced by the company surpassing its internal goal to flow 20% of revenue from new products and therapies to R&D innovation in FY25. To keep the product portfolio fresh and competitive, Medtronic was running 170+ Active Clinical Trials in FY25.
Global Manufacturing and Supply Chain Management
Moving physical devices globally requires a huge operational footprint. Medtronic plc's mission unites a global team of 95,000+ passionate people across more than 150 countries. To enhance efficiency, the company has been actively streamlining its operations, consolidating from 13 separate entities to a unified operations and supply chain organization. As of early 2024, they operated 78 plants globally.
Here's a snapshot of the scale of their FY25 financial output, which their supply chain supports:
| Portfolio/Segment | FY25 Revenue (Approximate) | FY25 Growth Driver Example |
|---|---|---|
| Total Worldwide Revenue | $33.537 billion | Overall company performance |
| Cardiovascular Portfolio | $12.5 billion | Strength in Structural Heart |
| Diabetes Operating Unit | $2.755 billion | Double-digit organic growth for six consecutive quarters |
| Cardiac Ablation Solutions | $1.0 billion | Strength of pulsed field ablation (PFA) products |
Clinical Trials and Regulatory Approval Processes
Getting these complex devices to market means navigating strict global requirements. This activity involves managing the 170+ Active Clinical Trials in FY25. Success here is measured by securing necessary clearances like the FDA approval and the CE Mark for European markets, which are non-negotiable steps before commercialization can occur in those regions. The focus on quality is also evident: Medtronic achieved a 34% reduction in aggregate product complaints in FY25, surpassing their goal of 10%.
Direct Sales and Surgical Support for Complex Medical Procedures
The sales force and clinical specialists are on the front lines, directly supporting surgeons. This is where the technology meets the patient. For instance, the Cardiovascular Portfolio saw robust performance, and the company served 79M+ patients in FY25. The direct support is critical for complex procedures, such as those involving their Cardiac Ablation Solutions, which saw significant revenue contribution.
Key areas demanding this direct support include:
- Supporting the launch of the MiniMed™ 780G system with the Instinct sensor.
- Driving adoption of the AiBLE ecosystem within the Neuroscience Portfolio.
- Providing expertise for procedures utilizing Pulsed Field Ablation (PFA) technology.
- Training healthcare professionals; over 1.15 million were trained over the past three years.
Implementing Value-Based Healthcare (VBC) Agreements
Medtronic plc actively engages in VBC agreements, shifting payment models to be contingent on patient outcomes and cost savings. This is a key strategic activity to align with evolving payer and provider incentives. You see this in several forms:
- An arrangement with Aetna evaluates patient outcomes and total cost of care for diabetes patients switching to an insulin pump.
- Close to 1,000 contracts for the Tyrx antibacterial sleeve require Medtronic to reimburse hospitals if the device fails to prevent infection after cardiac implants.
- The Value-Based HealthCare Outcomes Pledge Program offers a rebate if targeted goals, like reducing ventilator-associated pneumonia, aren't met.
- A past partnership with Lehigh Valley Health Network (LVHN) aimed to reduce the cost of care by $100 million for up to 500,000 patients.
This shift means payment for products and services may depend on how well their technologies improve clinical results and lower costs. Finance: draft 13-week cash view by Friday.
Medtronic plc (MDT) - Canvas Business Model: Key Resources
You're looking at the core assets Medtronic plc uses to run its global healthcare technology business as of late 2025. These aren't just line items; they are the foundation of their market position.
The intellectual property (IP) foundation is massive. Medtronic plc holds a total of 85,999 patents globally, with 49,911 of those patents being active as of the latest available data. This portfolio supports its position as a top global patent holder in the healthcare sector. The company was founded in 1949, giving it over 76 years of clinical data and brand establishment in the medical device industry.
The human capital supporting this is substantial. As of Fiscal Year 2025 (ending April 25, 2025), Medtronic plc reported a global workforce of 95,000 employees. More recently, data from October 2025 suggests this number is around 99K employees across 6 continents.
Key product platforms represent significant tangible resources, often backed by years of R&D investment:
- MiniMed 780G System: An automated insulin delivery system for Type 1 diabetes management in persons 7 years of age and older, featuring SmartGuard technology that adjusts insulin delivery every 5 minutes.
- Hugo RAS: The robotic-assisted surgery system, which received FDA clearance for urologic surgical procedures.
- PulseSelect PFA System: A pulsed field ablation system indicated for treating recurrent, symptomatic atrial fibrillation, engineered with differentiated safety features from 15 years of PFA research.
Financially, the company maintains a strong operational base, which is critical for funding ongoing R&D and shareholder returns. Here's a quick look at the scale based on the Fiscal Year 2025 results:
| Financial Metric (FY25) | Amount |
| Worldwide Revenue | $33.537 billion |
| GAAP Operating Profit | $5.955 billion |
| Cash from Operations | $7.044 billion |
| Free Cash Flow | $5.2 billion |
| Shareholders Returned | $6.3 billion |
The $7.044 billion cash from operations for FY25 represents a 3.79% increase from the prior year. Also, the company announced an increase in its dividend for Q1 FY26 to $0.71 per share, marking the 48th consecutive year of dividend increases.
Medtronic plc (MDT) - Canvas Business Model: Value Propositions
You're looking at the core promises Medtronic plc makes to the market, the tangible value they deliver across their vast portfolio. It's not just about selling devices; it's about measurable impact on human life and the economics of care delivery.
The foundational value proposition is scale of impact. Medtronic plc is delivering on its mission to alleviate pain, restore health, and extend life by reaching an enormous patient base. In fiscal year 2025 (FY25), the company reported serving more than 79 million patients globally. They are already setting a higher bar, with a stated goal to serve 82 million patients in FY26.
For chronic disease management, the integrated, data-driven solutions are a major draw, especially in Diabetes. The MiniMed 780G Automated Insulin Delivery (AID) system is expanding its reach significantly. Following its September 2025 FDA approval for type 2 diabetes, the system now addresses approximately 90% of the global diabetes population. Clinical efficacy is demonstrated by data showing patients on the system achieving an HbA1c reduction from 7.7% to 6.9% and Time in Range (TIR) reaching 84.9%. This system helps manage glucose by automating insulin adjustments every 5 minutes.
Here's a quick look at the financial scale supporting these value propositions, based on the latest reported fiscal year data:
| Metric | Value/Amount (FY25 or Latest) | Context/Segment |
| Total FY25 Revenue | $33.537 billion | Worldwide Revenue (as reported) |
| Diabetes FY25 Revenue | $2.755 billion | Reported Revenue |
| Diabetes FY25 Organic Growth | 11.5% | Year-over-year increase |
| Cardiovascular PFA FY25 Revenue | $1.0 billion | Pulsed Field Ablation Products |
| FY25 Cash from Operations | $7.044 billion | Cash Flow Metric |
In the surgical space, Medtronic plc is pushing minimally invasive care with platforms like the Hugo Robotic-Assisted Surgery (RAS) system. This system secured U.S. FDA approval in 2025 for use in urologic procedures, which include prostatectomy, nephrectomy, and cystectomy. The company sees this platform as a key driver for long-term growth, especially since the overall RAS market remains underpenetrated, leaving room for new entrants like Medtronic to gain traction.
For life-sustaining devices, reliability is paramount. The value proposition here is built on proven technology. For instance, the new OmniaSecure™ defibrillation lead is the smallest-diameter, lumenless option, but it is based on the 3830 pacing lead technology, which has a track record of safe and reliable treatment spanning over 20 years. Furthermore, the Cardiovascular division saw explosive growth, with its Pulse Field Ablation (PFA) franchise propelling revenue growth exceeding 10% in a recent quarter, demonstrating clinical adoption momentum.
Medtronic plc is also enabling cost-effective care by tying reimbursement to results through value-based contracts (VBCs). This shifts the focus from volume to outcomes. You can see this commitment in several areas:
- Medtronic APAC expanded its Value-Based Healthcare (VBHC) initiatives with remote monitoring in Southeast Asia in May 2025.
- A historical VBC for insulin pump therapy with UnitedHealthcare demonstrated cost savings for the payer ranging from 20% to 30%.
- The company holds approximately 1,000 contracts for its Tyrx antibacterial sleeve, where reimbursement is tied to preventing infection following cardiac implants.
This approach means the value proposition is directly linked to measurable clinical improvement thresholds for patients.
Medtronic plc (MDT) - Canvas Business Model: Customer Relationships
You're looking at how Medtronic plc maintains its deep connections across the healthcare spectrum, from major hospital systems to individual patients managing chronic conditions. It's a mix of high-touch human interaction and sophisticated digital support, which is key for a company with over 95,000 passionate people globally as of fiscal year 2025 (FY25).
Dedicated direct sales force and clinical specialists for B2B hospital accounts.
Medtronic plc relies on a substantial field presence to support its B2B hospital accounts across its diverse portfolio, which includes Cardiovascular, Neuroscience, and Medical-Surgical technologies. This direct engagement is crucial for complex device adoption, such as the Hugo robotic-assisted surgery system or the Evolut TAVR platform. The scale of the entire organization, employing over 90,000 people in more than 150 countries, underpins this relationship infrastructure.
- Total employees as of FY25: 95,000+.
- FY25 Net Sales: $33,537 million.
- FY25 U.S. Net Sales growth: 4%.
Around-the-clock technical support and digital patient services for B2C diabetes patients.
For patients managing diabetes, the relationship is heavily digitized, especially with the MiniMed 780G system and the Simplera Sync sensor. The goal here is to automate insulin delivery and simplify management, which directly impacts patient outcomes. The Diabetes unit, despite the planned spin-off, saw its net sales increase by 11% in FY25.
Real-world data shows the depth of this digital relationship:
- Patients using the MiniMed 780G system achieved 78.6% time in range after three years of use.
- Users of the Smart MDI system who responded to over 75% of alerts saw Time in Range (TIR) as high as 71.5%.
- The company expanded access and affordability by serving more than 79 million patients in FY25, with a goal to reach 82 million in FY26.
Value-based care (VBC) contracts that align payment with patient outcomes and cost savings.
Medtronic plc actively engages in VBC arrangements to tie reimbursement to quantifiable patient improvements, moving beyond simple product sales. This strategy is particularly relevant in chronic disease management like diabetes and cardiovascular care.
Here's a look at the financial and contractual scale of these relationships:
| Contract/Metric | Value/Detail | Context |
| UnitedHealthcare Insulin Pump VBC | 20% to 30% cost savings | For UnitedHealthcare plan members. |
| Tyrx Antibacterial Sleeve Contracts | About 1,000 contracts | Requires reimbursement to hospitals if infection prevention fails post-cardiac implant. |
| FY25 Diabetes Business Revenue | $721 million (Q1 FY26 reported) | Reflects the segment driving growth through connected devices. |
Long-term, consultative relationships with key opinion leaders (KOLs) and surgeons.
Building long-term, consultative ties with surgeons and KOLs is essential for the adoption of new therapies, like Pulsed Field Ablation (PFA) for atrial fibrillation, which saw Cardiac Ablation Solutions revenue increase nearly 50% in Q1 FY26. These relationships are part of a broader, high-value engagement strategy in the medical technology space.
- KOL Management Market Valuation (2025): USD 79.6 billion.
- Conservative modeled annual value from KOL data/tech for large firms: $25-$35 million.
- Medtronic's goal to train healthcare professionals over three years: 1.2 million by FY26.
Digital ecosystems providing real-time data and remote patient monitoring.
The company's digital footprint is significant, as seen in its position within the Digital Therapeutics Market. This ecosystem supports remote patient monitoring and data sharing, which is a catalyst for VBCs.
- Medtronic's share in the Digital Therapeutics Market: approximately 12.9%.
- FY25 Product Quality Improvement: 34% reduction in aggregate product complaints.
- FY25 Energy Sourcing: 50% from renewable and alternative sources.
Medtronic plc (MDT) - Canvas Business Model: Channels
Medtronic plc primarily sells its products through direct sales representatives and independent distributors globally. This direct engagement is crucial for complex medical devices requiring specialized clinical support and training at the point of care, such as in hospitals and surgical centers.
The company supports clinicians, healthcare systems, physicians, and patients across more than 150 countries. This massive footprint is supported by a workforce of approximately 95,000 people as of April 25, 2025. A portion of revenue is also generated from consignment inventory maintained at hospitals and through royalty and intellectual property arrangements.
The channel strategy is undergoing a structural shift, particularly with the planned separation of the Diabetes business. The core Medtronic model remains largely business-to-business, focusing on large institutions, but the resulting New Diabetes Company is expected to be mainly business-to-consumer. For context, the Diabetes business represented 8% of Medtronic revenue in fiscal year 2025.
The scale of the global distribution network and operational presence can be summarized:
| Metric | Value (As of FY2025) | Source Context |
| Worldwide Revenue | $33.537 billion | Fiscal Year 2025 Annual Revenue |
| Countries of Operation | More than 150 | Global Geographical Presence |
| Total Employees | 95,000+ | Global Workforce Count |
| Diabetes Revenue Share | 8% | Percentage of Total FY2025 Revenue |
Digital platforms and apps are an increasingly vital channel for patient engagement and device management, especially within the Diabetes segment. For the MiniMed 780G system, the estimated userbase was noted to be >700,000 individuals, though Medtronic has not shared an official update since 2020. Real-world data presented at ADA2025 involved a cohort of 374,548 users.
Medical education and training centers, specifically the Medtronic Academy, serve as a direct channel for knowledge transfer to healthcare professionals (HCPs). This platform is designed to enhance the safe and effective use of Medtronic products and therapies.
- Health professionals reached: 350K
- Countries with access: 174
- Courses and videos available: 4,000+
- Therapies & technologies covered: 115
The use of third-party distributors and agents remains a component of the go-to-market strategy, particularly in select international markets where direct infrastructure may be less established or where local expertise is leveraged. The company markets its medical supply products to materials managers, group purchasing organizations (GPOs), and integrated delivery networks (IDNs), often negotiating supply contracts with GPOs and IDNs for the benefit of their members.
Medtronic plc (MDT) - Canvas Business Model: Customer Segments
You're looking at the core groups Medtronic plc serves, which is a massive, diverse set of stakeholders across the globe. Honestly, thinking about Medtronic's customer base means looking beyond just the hospital purchasing department; it spans from the surgeon's hand to the patient's long-term care plan.
The largest segment is definitely the institutional buyer, the hospitals and clinics worldwide that purchase capital equipment and the steady stream of consumables. This B2B relationship is reflected in the performance of the major operating segments for fiscal year 2025 (FY25). For instance, the Cardiovascular Portfolio generated net sales of $12.5 billion in FY2025, showing a 5.49% increase over the prior year, which points directly to high-volume purchasing by cardiac centers. Similarly, the Neuroscience Portfolio brought in $9.84 billion in FY2025 revenue, indicating strong capital and device expenditure from neurosurgery and neuromodulation departments. The Medical Surgical Portfolio, while relatively flat year-over-year, still represents a significant base of surgical customers, totaling $8.407 billion in FY2025 sales.
Here's a quick look at how the primary revenue-generating segments stacked up in FY2025, which directly reflects the scale of the hospital/clinic segment:
| Business Segment | FY2025 Net Sales (in millions) | Year-over-Year Percent Change (FY2025 vs FY2024) |
| Cardiovascular Portfolio | $12,480 | 5.49% increase |
| Neuroscience Portfolio | $9,840 | 4.68% increase |
| Medical Surgical Portfolio | $8,407 | Flat |
| Diabetes Operating Unit | $2,755 | 11% increase |
Physicians and surgeons are the critical end-users who prescribe and utilize the devices daily. Their adoption drives the capital equipment sales mentioned above. For example, the strong growth in the Cardiovascular Portfolio was driven by the continued adoption of technologies like Cardiac Ablation Solutions, which saw revenue increase nearly 30% in Q4 FY25, largely due to pulsed field ablation (PFA) products. Also, the Diabetes Operating Unit saw an 11% increase in FY2025 revenue, which is tied directly to physician preference for systems like the MiniMed 780G and continuous glucose monitoring solutions.
The B2C component involves the millions of patients relying on Medtronic plc's technologies to manage chronic conditions. The company's overall impact is substantial, with their health tech improving the lives of two people every second across 150 countries. As of the FY25 data reflection, their technologies reimagine the treatment of over 70 health conditions. The sheer volume of patients served is a key metric for this segment:
- Patients served (FY25 data): 74+ million or 79 million (depending on the specific reporting banner)
- Conditions treated: Over 70
- Diabetes business revenue growth (FY2025): 11% increase
- Cardiac Rhythm & Heart Failure revenue (FY2025): $6,392 million
Finally, government health organizations and payers, like the U.S. Centers for Medicare & Medicaid Services (CMS), are crucial because they determine coverage and reimbursement rates, which directly impacts Medtronic's realized revenue. This segment is actively engaged with the company's latest innovations. To be fair, getting favorable NCD decisions is a major near-term focus. For instance, as of Medtronic plc's first quarter FY26 results in August 2025, the U.S. CMS had posted a proposed National Coverage Determination (NCD) for the Symplicity Spyral™ system for hypertension, with the final NCD expected on or before October 8, 2025. This decision will significantly impact the market access for that specific therapy.
Finance: draft a sensitivity analysis on revenue if the October 8th CMS NCD for Symplicity Spyral is delayed past Q4 FY26.
Medtronic plc (MDT) - Canvas Business Model: Cost Structure
You're looking at the major costs that keep Medtronic plc's global medical technology engine running. For a company this size, the cost structure is dominated by massive, necessary investments in production and innovation. Honestly, these aren't costs you can easily trim without impacting the core value proposition.
The sheer scale of Medtronic plc's operations means that a significant portion of its spending is tied up in high fixed costs. Think about the manufacturing facilities required to produce complex devices and the global distribution infrastructure needed to get those devices to hospitals and patients in over 150 countries. These assets represent a substantial, non-negotiable cost base.
Innovation is the lifeblood here, which translates directly into a major expense line. Medtronic plc poured $2.732 billion into Research & Development expense in Fiscal Year 2025 to keep its product pipeline fresh and maintain its leadership position. This is a cost of staying relevant in a field where technology moves fast.
The direct cost of making the products is substantial. For FY25, the Cost of Goods Sold (COGS), which is the direct cost of manufacturing before accounting for things like patent write-offs, hit $11.632 billion, excluding amortization of intangible assets. That figure alone shows the scale of their production footprint.
Beyond making the product, selling and running the business is another huge cost center. Selling, General, and Administrative (SG&A) expenses for FY25 totaled $10.849 billion. This covers everything from sales force compensation and marketing to the corporate overhead required to manage a worldwide enterprise.
Here's a quick look at the major expense categories for FY25, based on reported figures:
| Expense Category | FY25 Amount (in Billions USD) |
|---|---|
| Cost of Goods Sold (excl. Amortization) | $11.632 |
| Selling, General, and Administrative (SG&A) | $10.849 |
| Research & Development (R&D) | $2.732 |
| Amortization of Intangible Assets | $1.807 |
The nature of medical device work means that costs associated with regulatory compliance and clinical trials are embedded throughout the structure, particularly within R&D and SG&A. You can't launch a new therapy without extensive, costly testing and navigating the FDA and other global regulatory bodies. These are non-negotiable costs of market entry and maintenance.
To put the scale in perspective, these major costs compare against the total revenue base:
- FY25 Worldwide Revenue was $33.537 billion.
- FY25 GAAP Operating Profit was $5.955 billion.
- The combined COGS and SG&A alone accounted for over $22.481 billion.
It's a high-cost business model, defintely.
Medtronic plc (MDT) - Canvas Business Model: Revenue Streams
You're looking at Medtronic plc (MDT) revenue streams, and the picture for fiscal year 2025 (FY25) shows a company anchored by massive, recurring sales across specialized medical technology portfolios. Honestly, the core of the income is the sale of physical products, but the recurring element from disposables is what keeps the engine humming smoothly.
The top-line number for FY25 was a worldwide revenue of $33.537 billion. That's a solid base for a global medical device firm. The largest single contributor to that total was the Cardiovascular Portfolio, which brought in $12.481 billion in FY25 revenue. This segment's organic revenue growth was a healthy 6.3% for the year, showing strong adoption of their latest offerings, including technologies like TAVR systems.
The revenue streams fundamentally break down into three main buckets, though the financial reporting groups them by portfolio. You see the upfront sales of capital equipment-think of the big-ticket items like the Hugo RAS (robotic-assisted surgery) system-which are significant, one-time transactions. Then you have the high-volume, lower-cost consumables and disposables, like surgical staples or continuous glucose monitoring (CGM) sensors, which drive the recurring revenue component. Finally, there's the necessary service and maintenance contracts that keep that installed base of equipment running reliably for years after the initial sale.
Here's how the major revenue-generating segments stacked up for the full fiscal year 2025:
| Revenue Segment | FY25 Reported Revenue (in millions) | Percentage of Total Revenue (Approximate) |
| Cardiovascular Portfolio | $12,481 | 37.2% |
| Neuroscience Portfolio | $9,846 | 29.4% |
| Medical Surgical Portfolio | $8,407 | 25.1% |
| Diabetes Business | $2,755 | 8.2% |
The Cardiac Ablation Solutions business, a key part of Cardiovascular, is a great example of a high-growth product line, delivering $1.0 billion in revenue for FY25, largely driven by Pulsed Field Ablation (PFA) products. The Diabetes business, which is slated for separation, still contributed $2.755 billion in FY25.
The structure of these revenue streams is what gives Medtronic plc its financial durability. You can see the diversity in the numbers above, which helps mitigate risk if one area slows down. The recurring revenue from disposables and the service contracts are crucial because they provide predictable cash flow, which is what the market values highly in a mature healthcare company.
The primary revenue streams are:
- Sales of medical devices and capital equipment, including systems like Hugo RAS and TAVR.
- Recurring revenue from consumables and disposables, such as surgical staples and CGM sensors.
- Service and maintenance contracts covering the installed equipment base.
To be fair, the exact split between pure device sales, disposables, and service revenue across all segments isn't publicly itemized in the same way the portfolio revenue is, but the segment totals clearly reflect the combined effect of these sales activities. Finance: draft a sensitivity analysis on the impact of a 10% drop in recurring consumable revenue by next Tuesday.
Disclaimer
All information, articles, and product details provided on this website are for general informational and educational purposes only. We do not claim any ownership over, nor do we intend to infringe upon, any trademarks, copyrights, logos, brand names, or other intellectual property mentioned or depicted on this site. Such intellectual property remains the property of its respective owners, and any references here are made solely for identification or informational purposes, without implying any affiliation, endorsement, or partnership.
We make no representations or warranties, express or implied, regarding the accuracy, completeness, or suitability of any content or products presented. Nothing on this website should be construed as legal, tax, investment, financial, medical, or other professional advice. In addition, no part of this site—including articles or product references—constitutes a solicitation, recommendation, endorsement, advertisement, or offer to buy or sell any securities, franchises, or other financial instruments, particularly in jurisdictions where such activity would be unlawful.
All content is of a general nature and may not address the specific circumstances of any individual or entity. It is not a substitute for professional advice or services. Any actions you take based on the information provided here are strictly at your own risk. You accept full responsibility for any decisions or outcomes arising from your use of this website and agree to release us from any liability in connection with your use of, or reliance upon, the content or products found herein.