
|
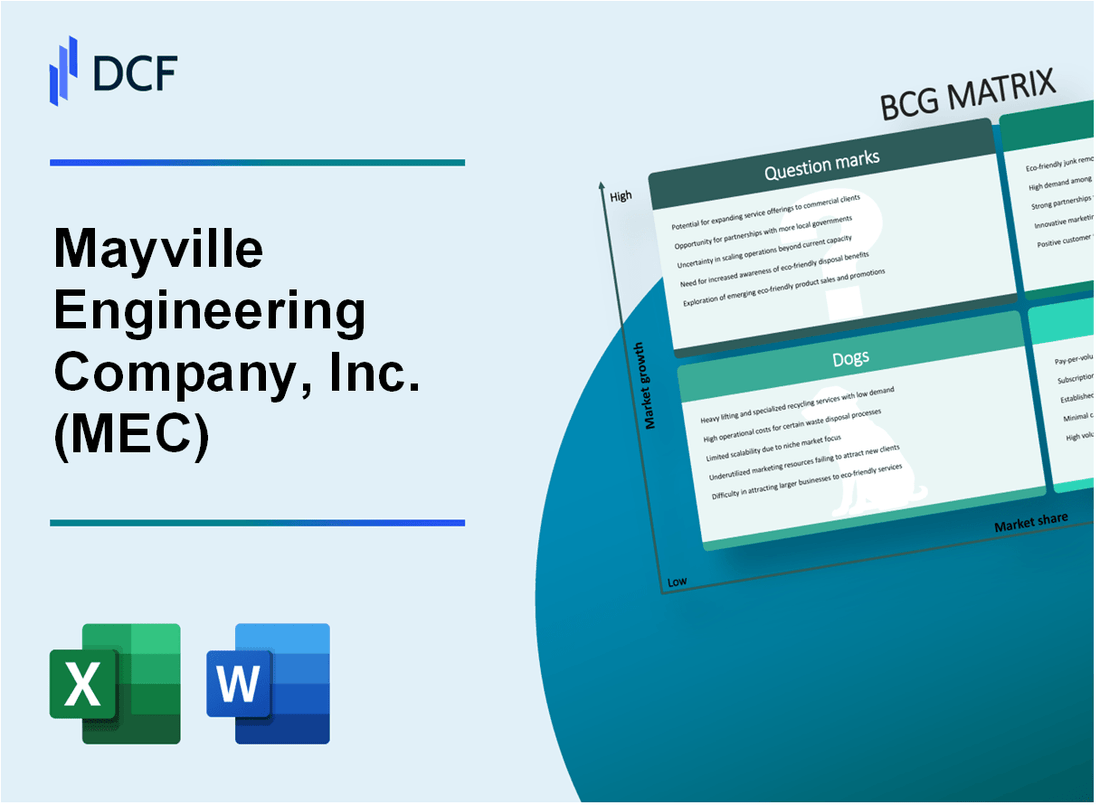
Mayville Engineering Company, Inc. (MEC): BCG Matrix [Dec-2025 Updated] |
Fully Editable: Tailor To Your Needs In Excel Or Sheets
Professional Design: Trusted, Industry-Standard Templates
Investor-Approved Valuation Models
MAC/PC Compatible, Fully Unlocked
No Expertise Is Needed; Easy To Follow
Mayville Engineering Company, Inc. (MEC) Bundle
You're looking for the real story behind Mayville Engineering Company, Inc.'s (MEC) current health, and after two decades analyzing industrial plays, the BCG Matrix defintely cuts right through the noise. As of late 2025, the picture is sharp: the Data Center segment is clearly a Star with a pipeline over $100 million, while legacy businesses like Commercial Vehicles act as reliable Cash Cows, underpinning that $49 million to $55 million Adjusted EBITDA guidance. But we also see trouble in the Dogs, like Agriculture seeing a 16.8% sales drop, and high-potential Question Marks like Military needing capital to win big. You need to see exactly where MEC's cash is flowing; check out the full breakdown below.
Background of Mayville Engineering Company, Inc. (MEC)
You're looking at Mayville Engineering Company, Inc. (MEC), which is a U.S.-based, vertically-integrated manufacturing partner. Honestly, MEC provides comprehensive solutions, covering everything from the initial design and prototyping right through to the final production of engineered components for original equipment manufacturers (OEMs).
Founded way back in 1945, Mayville Engineering Company, Inc. is headquartered in Milwaukee, Wisconsin, and it's recognized as the largest metal fabricator in the U.S. The company has built a significant footprint, operating 26 facilities across nine states as of late 2025. Their capabilities are broad, including metal fabrication, metal stamping, aluminum extrusion, tube bending, robotic welding, and custom coatings.
Mayville Engineering Company, Inc. serves a diverse set of end markets. These include heavy- and medium-duty commercial vehicles, construction & access equipment, powersports, agriculture, military, and increasingly, the data center and critical power sectors.
Looking at the most recent figures, for the third quarter of 2025, Mayville Engineering Company, Inc. reported total net sales of $144.3 million, which was a 6.6% year-over-year increase. However, you need to note that this top-line growth was primarily fueled by the acquisition of Accu-Fab, as the organic net sales actually decreased by 9.1% compared to the prior year. Profitability was under pressure; the company posted a GAAP net loss of $2.7 million for the quarter, though Adjusted EBITDA came in at $14.1 million, representing a 9.8% margin.
The balance sheet reflects some recent activity, with the net leverage ratio standing at 3.5x as of September 30, 2025. Furthermore, Free Cash Flow for that same quarter was negative at ($1.1) million. Management, despite these mixed results, maintained its full-year 2025 revenue guidance, projecting sales between $528-562 million. This guidance reflects a strategic pivot, as Mayville Engineering Company, Inc. is actively trying to capture growth in areas like data centers while navigating headwinds in legacy markets, such as the commercial vehicle segment, which faced a projected 28% decline in 2025.
Mayville Engineering Company, Inc. (MEC) - BCG Matrix: Stars
You're looking at the segment of Mayville Engineering Company, Inc. (MEC) that is clearly leading the pack in terms of market expansion potential. This is where the future cash cow resides, but it demands significant capital right now to maintain that leadership position. The Data Center & Critical Power segment, significantly bolstered by the Accu-Fab acquisition, is the engine driving this high-growth classification for MEC.
This Star quadrant is characterized by high market share in a market that is expanding rapidly, and the numbers coming out of this area show that momentum. Here is a snapshot of the key financial and operational indicators supporting this classification as of the latest reported data:
| Metric | Value |
| Qualified Opportunity Pipeline (Data Center & Critical Power) | Exceeding $100 million |
| Projected 2026 Revenue Synergies (Accu-Fab) | Between $20 million and $30 million |
| Projected Segment Share of Overall Sales (2026) | At least 20% |
| Accu-Fab Contribution to Q3 2025 Net Sales | $21.2 million |
| Total Net Sales (Q3 2025) | $144.3 million |
| Full-Year 2025 Net Sales Guidance Range | $528 million to $562 million |
The market leadership here is not just potential; it is being converted into tangible business. The qualified opportunity pipeline for the Data Center & Critical Power market is reported to exceed $100 million, signaling substantial future revenue streams. Furthermore, MEC has already secured new business awards in this specific area totaling approximately $30 million in the third quarter of 2025 alone. This segment is expected to be a major contributor, projected to represent at least 20% of overall sales by 2026, up from the initial post-acquisition estimate of about 10% of overall sales.
To keep this Star shining brightly and capture that market growth, significant investment is required, which is why it consumes cash almost as fast as it generates it. The investment is focused on scaling operations to meet future demand and realizing the full potential of the integration:
- Projected annual cost synergies from implementing MEC's operational excellence framework at Accu-Fab are targeted at approximately $1.0 million by 2026.
- The Accu-Fab acquisition was completed for a total consideration of $140.5 million.
- Pro forma net leverage following the acquisition was 3.1x at the end of Q2 2025, increasing to 3.5x as of September 30, 2025.
- The company's strategy is to sustain success here until the high-growth market slows, at which point this unit should transition into a Cash Cow.
Sustaining this high-growth trajectory requires capital for promotion and placement, which is why MEC is actively managing its balance sheet, aiming to reduce the net leverage ratio to 3 times or lower by 2026. If MEC successfully maintains its market share as the market growth rate naturally decelerates, this segment will become the primary source of cash generation for the entire company.
Mayville Engineering Company, Inc. (MEC) - BCG Matrix: Cash Cows
Cash Cows are business units or products with a high market share but low growth prospects. Mayville Engineering Company, Inc. (MEC)'s core metal fabrication business maintains a high relative market share in mature, cyclical OEM markets, which is the classic setup for this quadrant. These units generate more cash than they consume, funding other parts of the portfolio.
The Commercial Vehicle segment, historically a major revenue contributor, is showing classic Cash Cow strain but still provides necessary cash flow. For the third quarter of 2025, net sales to this end market declined by 24% year-over-year. This softness is expected to continue, with the projection for Class 8 production in 2025 being a 28% decline. Still, the discipline across the company helps support the overall financial outlook.
Construction & Access equipment, another legacy segment, also faces headwinds, though it showed some resilience in Q3 2025 with total net sales increasing 10.1% year-over-year, partially due to the Accu-Fab acquisition. Organic net sales growth in this market for the quarter was 6.2%. These segments, despite softness, contribute to the company's overall 2025 Adjusted EBITDA guidance of $49 million to $55 million.
The focus for these mature businesses is on efficiency and 'milking' the gains passively, rather than heavy investment in promotion. Investments supporting infrastructure can improve efficiency and increase cash flow further. For instance, the company's Q3 2025 Adjusted EBITDA was $14.1 million, representing a 9.8% margin. This performance, while lower than the prior year's 12.6% margin, shows the underlying profitability that defines a Cash Cow, even in a soft environment.
You need to see the hard numbers that underpin the stability these segments offer:
| Metric | Value | Period/Context |
| Full Year 2025 Adjusted EBITDA Guidance | $49 million to $55 million | FY 2025 |
| Commercial Vehicle Sales Decline | 24% | Q3 2025 YoY |
| Construction & Access Net Sales Growth | 10.1% | Q3 2025 YoY |
| Q3 2025 Adjusted EBITDA | $14.1 million | Q3 2025 |
| Q3 2025 Adjusted EBITDA Margin | 9.8% | Q3 2025 |
The strategy here is clear: maintain productivity and extract maximum cash flow. You're looking for operational discipline to offset volume pressure. Here's what the Q3 results tell us about managing these mature assets:
- Manufacturing margin rate was 11.0% of net sales in Q3 2025.
- Q3 2025 Free Cash Flow was negative at ($1.1 million).
- Net leverage ratio stood at 3.5x as of September 30, 2025.
- The company reaffirmed its full-year 2025 guidance in Q3.
The core metal fabrication business must continue to generate the cash needed to cover corporate overhead and fund the growth areas, like Data Center & Critical Power, which saw $22.6 million in Q3 net sales. Finance: draft a sensitivity analysis on the $49 million lower bound of the EBITDA guidance by Friday.
Mayville Engineering Company, Inc. (MEC) - BCG Matrix: Dogs
Dogs, in the Boston Consulting Group Matrix framework, represent business units or product lines stuck in low-growth markets and possessing a low relative market share. For Mayville Engineering Company, Inc. (MEC), these areas are candidates for divestiture or aggressive cost minimization because expensive turn-around plans rarely pay off here. They are cash traps, tying up capital without generating significant returns.
The Agriculture end market clearly fits this profile for MEC as of Q3 2025. This segment saw a significant net sales decline of 16.8% year-over-year, reflecting the low-growth, high-headwind environment characteristic of a Dog. To be fair, the actual reported decrease in net sales to the Agriculture market was 21.8% versus the prior year period, driven by continued lower customer demand across both large-ag and small-ag sectors. This segment faces sustained soft demand and customer destocking, which means management should be requiring minimal capital investment to keep the lights on, not fund expansion.
The financial drag from these low-performing units is evident when looking at the consolidated results. These weak areas contribute directly to the overall Q3 2025 GAAP Net Loss of $2.7 million. That loss, when compared to the net income of $3.0 million in the prior year period, shows the severity of the headwinds in these mature or declining areas.
Another area falling into the Dog quadrant includes certain legacy industrial equipment and consumer tools grouped within the 'Other' category. These areas showed an organic net sales decline of 5.1% in Q3 2025. You see the pattern: low growth, negative momentum, and minimal strategic upside.
Here's a quick look at the financial pressure points associated with these Dog segments:
- Agriculture end market Q3 2025 net sales decline: 16.8%
- 'Other' category organic net sales decline Q3 2025: 5.1%
- Contribution to overall Q3 2025 GAAP Net Loss: $2.7 million
- Manufacturing margin rate compression: Declined to 11.0% of net sales from 12.6% YoY.
The performance metrics for these challenged areas are summarized below, showing the cash consumption versus the high-growth segments:
| Metric | Value | Context |
| Q3 2025 GAAP Net Loss | $2.7 million | Overall company result impacted by legacy softness. |
| Adjusted EBITDA Margin | 9.8% | Compressed from 12.6% in Q3 2024. |
| Free Cash Flow (FCF) | ($1.1) million | Turned negative in Q3 2025. |
| Agriculture Sales Decline (Actual) | 21.8% | Year-over-year decrease in the Dog-like segment. |
When you have segments like Agriculture reporting a 21.8% drop, it confirms that capital is better deployed elsewhere, like the Data Center & Critical Power market, which is showing growth. The strategy here for MEC must be to minimize cash tied up in these Dogs. You're looking at units that are not generating the cash needed to fund the Stars or Question Marks. Finance: draft the divestiture impact analysis for the Agriculture unit by next Tuesday.
Mayville Engineering Company, Inc. (MEC) - BCG Matrix: Question Marks
You're looking at business units that are in markets growing fast but where Mayville Engineering Company, Inc. (MEC) hasn't yet secured a dominant position. These are the Question Marks that demand capital to fight for share.
The Military end market is a prime example of this high-growth potential, showing a strong Q3 2025 growth rate of 7-9% year-over-year. This segment represents a smaller piece of the pie right now but has significant market growth potential, meaning it requires continued, focused investment to build relative share against competitors.
Contrast this with the Powersports segment, which posted a more modest Q3 2025 sales increase of only 1.9%. While not as explosive as Military, its inclusion here suggests it's a growth area that needs support to accelerate its market penetration, especially when viewed against the broader company performance.
The overall organic net sales decline of 9.1% in Q3 2025 highlights the critical need to invest in these smaller, growing areas to offset the softness in legacy markets. These Question Marks are consuming cash now, hoping to become Stars later.
The financial reality of this investment phase is clear: the company's negative Free Cash Flow of ($1.1) million in Q3 2025 suggests capital is actively being deployed into these high-potential, high-cost areas. You have to spend to gain ground.
Here's a quick look at the recent performance of these segments:
| End Market | Q3 2025 Growth Rate (YoY) | Implication for BCG Quadrant |
| Military | 7-9% | High Growth Market, Low Relative Share (Potential Star) |
| Powersports | 1.9% Sales Increase | Growth Market Requiring Investment to Gain Share |
The strategy for these units is binary: invest heavily to rapidly increase market share, or divest if the potential isn't there. Mayville Engineering Company, Inc. is currently showing the investment behavior, as evidenced by the negative cash flow.
Key financial indicators reflecting the cash drain of these growth bets include:
- Q3 2025 Free Cash Flow: ($1.1) million.
- Organic Net Sales Change (Q3 2025): Decrease of 9.1%.
- Net Leverage Ratio (as of September 30, 2025): 3.5x.
The company's decision to invest is tied to capturing long-term opportunities, particularly in areas like Data Center & Critical Power, which also showed strong growth, but the Military and Powersports segments fit the classic Question Mark profile of needing cash infusion to move up the market share ladder.
Finance: draft 13-week cash view by Friday.
Disclaimer
All information, articles, and product details provided on this website are for general informational and educational purposes only. We do not claim any ownership over, nor do we intend to infringe upon, any trademarks, copyrights, logos, brand names, or other intellectual property mentioned or depicted on this site. Such intellectual property remains the property of its respective owners, and any references here are made solely for identification or informational purposes, without implying any affiliation, endorsement, or partnership.
We make no representations or warranties, express or implied, regarding the accuracy, completeness, or suitability of any content or products presented. Nothing on this website should be construed as legal, tax, investment, financial, medical, or other professional advice. In addition, no part of this site—including articles or product references—constitutes a solicitation, recommendation, endorsement, advertisement, or offer to buy or sell any securities, franchises, or other financial instruments, particularly in jurisdictions where such activity would be unlawful.
All content is of a general nature and may not address the specific circumstances of any individual or entity. It is not a substitute for professional advice or services. Any actions you take based on the information provided here are strictly at your own risk. You accept full responsibility for any decisions or outcomes arising from your use of this website and agree to release us from any liability in connection with your use of, or reliance upon, the content or products found herein.