
|
Mirion Technologies, Inc. (MIR) DCF Valuation |
Fully Editable: Tailor To Your Needs In Excel Or Sheets
Professional Design: Trusted, Industry-Standard Templates
Investor-Approved Valuation Models
MAC/PC Compatible, Fully Unlocked
No Expertise Is Needed; Easy To Follow
Mirion Technologies, Inc. (MIR) Bundle
Looking to assess the intrinsic value of Mirion Technologies, Inc.? Our (MIR) DCF Calculator integrates real-world data with extensive customization features, enabling you to refine your forecasts and make more informed investment choices.
Discounted Cash Flow (DCF) - (USD MM)
| Year | AY1 2020 |
AY2 2021 |
AY3 2022 |
AY4 2023 |
AY5 2024 |
FY1 2025 |
FY2 2026 |
FY3 2027 |
FY4 2028 |
FY5 2029 |
|---|---|---|---|---|---|---|---|---|---|---|
| Revenue | .0 | 668.3 | 717.8 | 800.9 | 860.8 | 917.7 | 978.5 | 1,043.2 | 1,112.2 | 1,185.8 |
| Revenue Growth, % | 0 | 0 | 7.41 | 11.58 | 7.48 | 6.62 | 6.62 | 6.62 | 6.62 | 6.62 |
| EBITDA | -2.4 | 92.6 | 104.3 | 149.0 | 179.0 | 308.0 | 328.3 | 350.1 | 373.2 | 397.9 |
| EBITDA, % | 100 | 13.86 | 14.53 | 18.6 | 20.79 | 33.56 | 33.56 | 33.56 | 33.56 | 33.56 |
| Depreciation | .0 | 112.2 | 174.5 | 162.8 | 150.4 | 328.4 | 350.1 | 373.3 | 397.9 | 424.3 |
| Depreciation, % | 100 | 16.79 | 24.31 | 20.33 | 17.47 | 35.78 | 35.78 | 35.78 | 35.78 | 35.78 |
| EBIT | -2.4 | -19.6 | -70.2 | -13.8 | 28.6 | 163.2 | 173.9 | 185.5 | 197.7 | 210.8 |
| EBIT, % | 100 | -2.93 | -9.78 | -1.72 | 3.32 | 17.78 | 17.78 | 17.78 | 17.78 | 17.78 |
| Total Cash | .4 | 88.9 | 77.8 | 134.1 | 181.1 | 297.2 | 316.9 | 337.8 | 360.2 | 384.0 |
| Total Cash, percent | .0 | .0 | .0 | .0 | .0 | .0 | .0 | .0 | .0 | .0 |
| Account Receivables | .0 | 213.7 | 225.6 | 230.4 | 244.7 | 404.9 | 431.7 | 460.3 | 490.7 | 523.2 |
| Account Receivables, % | 100 | 31.98 | 31.43 | 28.77 | 28.43 | 44.12 | 44.12 | 44.12 | 44.12 | 44.12 |
| Inventories | .0 | 123.6 | 143.3 | 144.1 | 133.2 | 315.6 | 336.4 | 358.7 | 382.4 | 407.7 |
| Inventories, % | 100 | 18.49 | 19.96 | 17.99 | 15.47 | 34.38 | 34.38 | 34.38 | 34.38 | 34.38 |
| Accounts Payable | 1.0 | 59.4 | 67.7 | 58.7 | 56.5 | 242.7 | 258.7 | 275.8 | 294.1 | 313.6 |
| Accounts Payable, % | 100 | 8.89 | 9.43 | 7.33 | 6.56 | 26.44 | 26.44 | 26.44 | 26.44 | 26.44 |
| Capital Expenditure | -19.9 | -17.6 | -34.2 | -37.1 | -48.8 | -32.5 | -34.6 | -36.9 | -39.4 | -42.0 |
| Capital Expenditure, % | 100 | -2.63 | -4.76 | -4.63 | -5.67 | -3.54 | -3.54 | -3.54 | -3.54 | -3.54 |
| Tax Rate, % | -6.49 | -6.49 | -6.49 | -6.49 | -6.49 | -6.49 | -6.49 | -6.49 | -6.49 | -6.49 |
| EBITAT | -2.4 | -19.1 | -63.4 | -12.7 | 30.5 | 156.3 | 166.7 | 177.7 | 189.5 | 202.0 |
| Depreciation | ||||||||||
| Changes in Account Receivables | ||||||||||
| Changes in Inventories | ||||||||||
| Changes in Accounts Payable | ||||||||||
| Capital Expenditure | ||||||||||
| UFCF | -21.4 | -203.4 | 53.6 | 98.4 | 126.5 | 295.8 | 450.5 | 480.3 | 512.1 | 546.0 |
| WACC, % | 8.12 | 8.1 | 8.03 | 8.04 | 8.12 | 8.08 | 8.08 | 8.08 | 8.08 | 8.08 |
| PV UFCF | ||||||||||
| SUM PV UFCF | 1,785.3 | |||||||||
| Long Term Growth Rate, % | 2.00 | |||||||||
| Free cash flow (T + 1) | 557 | |||||||||
| Terminal Value | 9,157 | |||||||||
| Present Terminal Value | 6,209 | |||||||||
| Enterprise Value | 7,994 | |||||||||
| Net Debt | 545 | |||||||||
| Equity Value | 7,450 | |||||||||
| Diluted Shares Outstanding, MM | 205 | |||||||||
| Equity Value Per Share | 36.34 |
What You Will Get
- Editable Excel Template: A fully customizable Excel-based DCF Calculator featuring pre-filled real MIR financials.
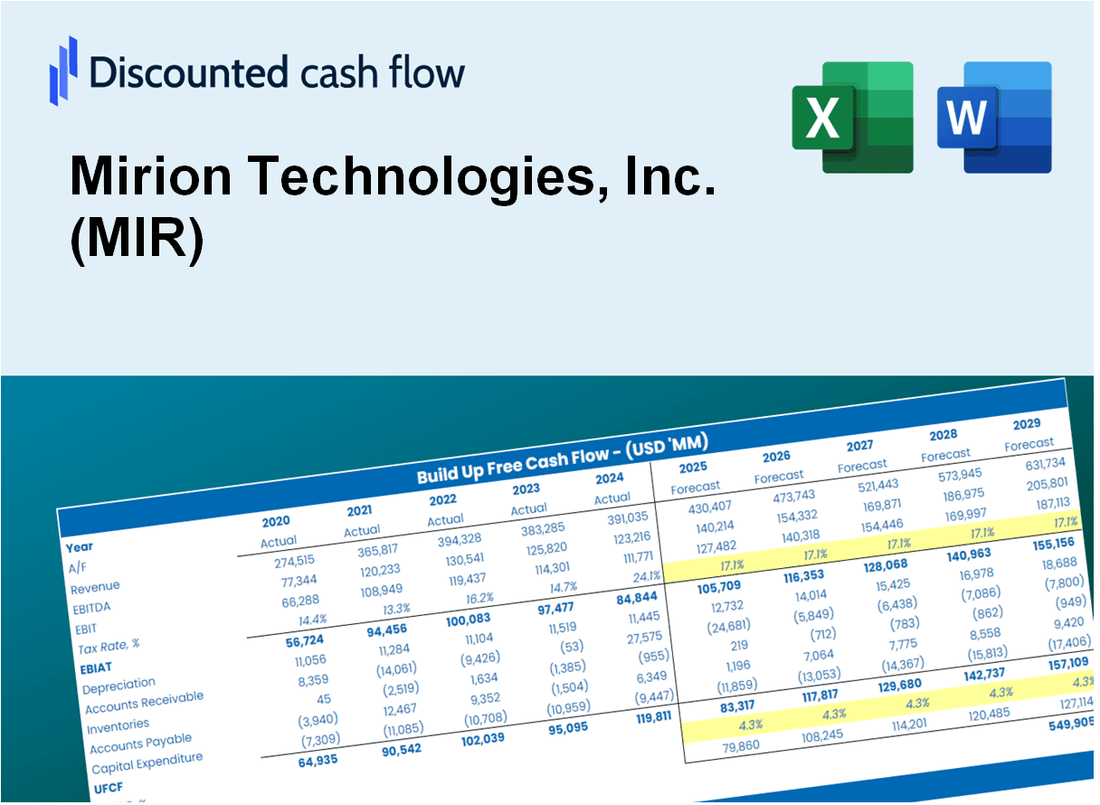
- Real-World Data: Historical data and forward-looking estimates (as highlighted in the yellow cells).
- Forecast Flexibility: Adjust forecast assumptions such as revenue growth, EBITDA %, and WACC.
- Automatic Calculations: Instantly observe the effect of your inputs on Mirion Technologies’ valuation.
- Professional Tool: Designed for investors, CFOs, consultants, and financial analysts.
- User-Friendly Design: Organized for clarity and ease of use, complete with step-by-step instructions.
Key Features
- Comprehensive Financial Data: Mirion Technologies’ historical financial statements and pre-filled projections.
- Customizable Inputs: Adjust WACC, tax rates, revenue growth, and EBITDA margins as needed.
- Real-Time Calculations: View Mirion Technologies’ intrinsic value update instantly.
- Intuitive Visual Outputs: Dashboard graphs showcase valuation results and essential metrics.
- Designed for Precision: A reliable tool for analysts, investors, and finance professionals.
How It Works
- Download: Obtain the comprehensive Excel file featuring Mirion Technologies, Inc. (MIR) financial data.
- Customize: Tailor your forecasts, including revenue growth, EBITDA %, and WACC.
- Update Automatically: Watch as intrinsic value and NPV calculations refresh in real-time.
- Test Scenarios: Generate various projections and instantly compare the results.
- Make Decisions: Leverage the valuation insights to inform your investment approach.
Why Choose This Calculator for Mirion Technologies, Inc. (MIR)?
- User-Friendly Interface: Tailored for both novices and seasoned professionals.
- Customizable Inputs: Easily adjust parameters to suit your specific analysis needs.
- Real-Time Feedback: Observe immediate updates to Mirion’s valuation as you modify inputs.
- Pre-Loaded Data: Comes equipped with Mirion’s actual financial metrics for swift evaluations.
- Relied Upon by Experts: Favored by investors and analysts for making well-informed choices.
Who Should Use Mirion Technologies, Inc. (MIR)?
- Investors: Gain insights into the market with advanced analytics tailored for informed decision-making.
- Financial Analysts: Enhance productivity with customizable financial models specific to the technology sector.
- Consultants: Effortlessly modify presentations and reports to meet client needs in the radiation detection industry.
- Tech Enthusiasts: Explore the latest innovations in radiation detection and measurement through practical applications.
- Educators and Students: Utilize as a comprehensive resource for learning about technology and finance in academic settings.
What the Template Contains
- Historical Data: Includes Mirion Technologies’ past financials and baseline forecasts.
- DCF and Levered DCF Models: Detailed templates to calculate Mirion Technologies’ intrinsic value.
- WACC Sheet: Pre-built calculations for Weighted Average Cost of Capital.
- Editable Inputs: Modify key drivers like growth rates, EBITDA %, and CAPEX assumptions.
- Quarterly and Annual Statements: A complete breakdown of Mirion Technologies’ financials.
- Interactive Dashboard: Visualize valuation results and projections dynamically.
Disclaimer
All information, articles, and product details provided on this website are for general informational and educational purposes only. We do not claim any ownership over, nor do we intend to infringe upon, any trademarks, copyrights, logos, brand names, or other intellectual property mentioned or depicted on this site. Such intellectual property remains the property of its respective owners, and any references here are made solely for identification or informational purposes, without implying any affiliation, endorsement, or partnership.
We make no representations or warranties, express or implied, regarding the accuracy, completeness, or suitability of any content or products presented. Nothing on this website should be construed as legal, tax, investment, financial, medical, or other professional advice. In addition, no part of this site—including articles or product references—constitutes a solicitation, recommendation, endorsement, advertisement, or offer to buy or sell any securities, franchises, or other financial instruments, particularly in jurisdictions where such activity would be unlawful.
All content is of a general nature and may not address the specific circumstances of any individual or entity. It is not a substitute for professional advice or services. Any actions you take based on the information provided here are strictly at your own risk. You accept full responsibility for any decisions or outcomes arising from your use of this website and agree to release us from any liability in connection with your use of, or reliance upon, the content or products found herein.