
|
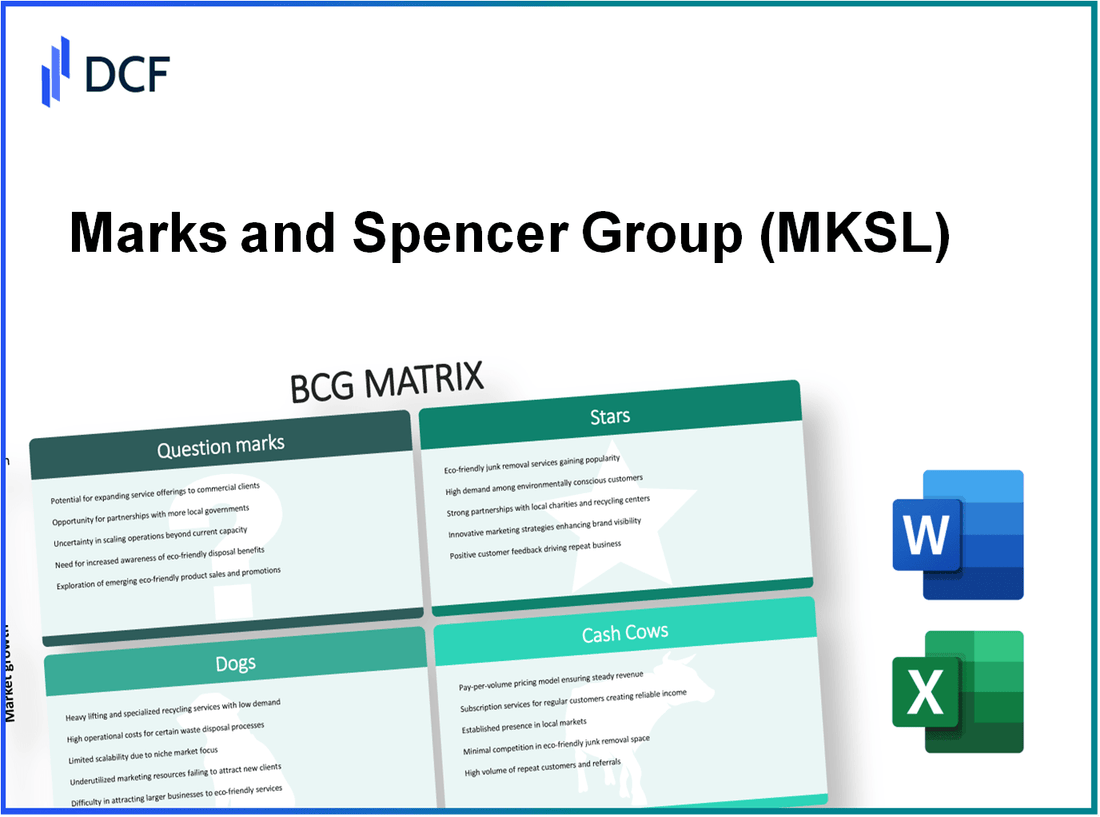
Marks and Spencer Group plc (MKS.L): BCG Matrix |
Fully Editable: Tailor To Your Needs In Excel Or Sheets
Professional Design: Trusted, Industry-Standard Templates
Investor-Approved Valuation Models
MAC/PC Compatible, Fully Unlocked
No Expertise Is Needed; Easy To Follow
Marks and Spencer Group plc (MKS.L) Bundle
In the dynamic landscape of retail, understanding where a company stands can be pivotal for investors and analysts alike. Marks and Spencer Group plc, a stalwart in the UK retail scene, navigates a complex portfolio of products and services, each positioned uniquely within the Boston Consulting Group (BCG) Matrix. From the burgeoning success of their online operations deemed as 'Stars' to the potential pitfalls of 'Dogs,' this analysis unveils the strategic placement of Marks and Spencer's business segments. Delve deeper to discover how these categories shape the future of one of Britain's most iconic retailers.
Background of Marks and Spencer Group plc
Marks and Spencer Group plc, commonly referred to as M&S, is a British multinational retailer headquartered in Westminster, London. Founded in 1884 by Michael Marks and Thomas Spencer, it started as a market stall in Leeds and has evolved into a major player in the UK retail industry. M&S operates through two main segments: food and clothing & home. The company is renowned for its high-quality food products, including ready meals, fresh produce, and premium grocery items.
As of October 2023, M&S operates over 1,000 stores across the UK and has expanded its reach into international markets, including locations in Europe, Asia, and the Middle East. The brand is particularly noted for its commitment to sustainability and quality, aiming to achieve significant milestones in reducing waste and improving sourcing practices.
In the fiscal year ending March 2023, Marks & Spencer reported revenue of approximately £11.5 billion, with a pre-tax profit of around £522 million. The food division accounted for a substantial portion of these earnings, demonstrating resilience amid changing consumer preferences and inflationary pressures. M&S has leveraged its online platform, which has seen growth, particularly during the pandemic, expanding its e-commerce capabilities to cater to the changing shopping habits of consumers.
The company's recent transformation strategy has focused on modernizing its supply chain and enhancing customer experience, aiming to strengthen its competitive position in a challenging retail environment. M&S's loyalty program, Sparks, has been instrumental in retaining customers and increasing engagement, while the company has also embraced digital solutions to streamline operations and improve shopping convenience.
Despite its strong market presence and historical significance, M&S has faced challenges including competition from discount retailers and changes in consumer behavior, which have impacted its market share. The focus on innovation and sustainability remains crucial as the company navigates this dynamic landscape in the retail sector.
Marks and Spencer Group plc - BCG Matrix: Stars
Marks and Spencer Group plc (M&S) has identified several key segments that fall under the Stars category within the BCG Matrix. These segments not only exhibit high market share but also demonstrate substantial growth potential.
Online Retail Operations
Marks and Spencer's online retail operations have seen a significant uptick, particularly during the pandemic, resulting in a remarkable growth trajectory. In the fiscal year ending March 2023, online sales accounted for approximately 47% of total revenue, reflecting a growth of 24% year-on-year. The company reported online revenue reaching approximately £1.2 billion.
The increasing investment in technology and digital infrastructure has enhanced customer experience and operational efficiency. M&S has allocated around £100 million to bolster its online platform, focusing on improving logistics and user experience.
Clothing and Homeware Segments in High-Growth Markets
The Clothing and Home division has emerged as a Star for M&S, with significant advancements in both market share and revenue. For the financial year 2023, this segment experienced a sales increase of 12%, reaching about £3 billion. The company has reported a market share of approximately 10.5% in the UK clothing market.
| Segment | Revenue (FY 2023) | Market Share | Year-on-Year Growth |
|---|---|---|---|
| Clothing and Home | £3 billion | 10.5% | 12% |
Additionally, the expansion into international markets, particularly in Asia, has contributed to growing brand recognition and sales. The international clothing market has been a key driver for M&S, contributing approximately £400 million in revenue, with a growth rate of 15%.
Food Delivery and Partnerships with Other Grocery Delivery Services
M&S has capitalized on the booming food delivery sector by partnering with services like Deliveroo and Uber Eats. The food segment, which comprises both in-store and online sales, posted revenues of approximately £2.5 billion in FY 2023, marking a year-on-year growth of 8%.
The strategic partnerships have allowed M&S to reach a wider customer base, with food delivery sales increasing by 35% as consumers shifted focus towards convenience. The company aims to double its online food sales to £500 million by 2025.
| Partnership | Revenue Contribution (FY 2023) | Growth Rate |
|---|---|---|
| Deliveroo | £150 million | 35% |
| Uber Eats | £100 million | 30% |
Overall, these segments underline Marks and Spencer's strategic positioning within the market as a leader in high-growth areas. The company continues to invest significantly in these Stars, ensuring sustained cash flow and market dominance.
Marks and Spencer Group plc - BCG Matrix: Cash Cows
In the context of Marks and Spencer Group plc, several segments qualify as Cash Cows, primarily due to their high market share in mature markets and stable cash flow generation. Let's explore these segments in detail.
UK Food Retail Segment
The UK food retail segment has consistently been a strong performer for Marks and Spencer, holding a significant share in the competitive UK grocery market. As of the latest financial reports, Marks and Spencer's food division generated revenues of approximately £5.3 billion in the fiscal year ending March 2023. This translates to a market share of around 3.4% in the UK grocery sector.
The food department benefits from high margins, with operating profit margins reported at about 7.5%. This stability allows for minimal investment in promotional activities while still generating considerable cash flow. In addition, the segment reported a growth in like-for-like sales of 11.9% during the first half of 2023, showcasing resilience even in a mature market.
Long-established Clothing Lines
The clothing segment, especially its long-established lines such as M&S Collection, has maintained a strong position despite the competitive pressures in the retail apparel market. The clothing revenue for Marks and Spencer was around £2.4 billion for FY 2023, constituting approximately 12% of the total UK clothing market share.
Although growth in this segment has slowed, the profitability remains high, with gross margins reported at 43.5%. This allows the company to sustain cash flow while requiring less investment in marketing and promotional efforts compared to newer product lines.
Real Estate Investments in Prime Locations
Marks and Spencer also holds a substantial portfolio of real estate assets situated in prime retail locations. The company’s real estate valuation stood at approximately £1.8 billion as of 2023. These investments generate steady income through rental agreements and have appreciated significantly over time.
The real estate segment not only provides a revenue stream but also serves as collateral for funding potential expansions in other areas of the business. As of March 2023, rental income reported was around £132 million, which contributes to the overall cash flow that supports operational budgets and dividends to shareholders.
| Segment | Revenue (FY 2023) | Market Share | Operating Profit Margin | Rental Income |
|---|---|---|---|---|
| UK Food Retail | £5.3 billion | 3.4% | 7.5% | N/A |
| Long-established Clothing Lines | £2.4 billion | 12% | 43.5% | N/A |
| Real Estate Investments | £1.8 billion (valuation) | N/A | N/A | £132 million |
By leveraging these Cash Cows, Marks and Spencer is in a strong position to support future investments, manage debt, and deliver consistent returns to shareholders.
Marks and Spencer Group plc - BCG Matrix: Dogs
Marks and Spencer Group plc has several product lines and business units categorized as 'Dogs' according to the Boston Consulting Group (BCG) Matrix. These segments exhibit low growth potential and market share, often becoming financial burdens for the company.
Underperforming International Stores
Marks and Spencer has faced challenges with its international presence, particularly in markets such as the United States and India. In the fiscal year 2021, the company reported a £37 million loss from its international operations. The underperformance can be attributed to increased competition and shifting consumer preferences.
| Region | Market Share (%) | Yearly Sales (£ million) | Operating Loss (£ million) |
|---|---|---|---|
| United States | 1.5 | £20 | £10 |
| India | 2.0 | £15 | £5 |
| Europe | 3.0 | £30 | £12 |
These figures indicate a consistent trend of diminishing returns, reflecting the challenges Marks and Spencer faces in maintaining a competitive edge in these international markets.
Outdated Product Lines with Declining Sales
Marks and Spencer's clothing division has struggled with outdated product lines, especially in its traditional apparel offerings. The company reported a 10% decline in clothing sales for the 2021 fiscal year, largely due to a failure to adapt to current fashion trends. The shift towards online shopping further exacerbated the issues faced by these product lines.
- Women’s Wear: Down 12% year-on-year
- Men’s Wear: Down 8% year-on-year
- Kids Wear: Down 5% year-on-year
These outdated product offerings not only contribute to poor sales figures but also tie up resources that could be redirected towards more profitable segments.
Non-Core Business Units with Minimal Market Share
Marks and Spencer has several non-core business units that have struggled to generate significant market share. These include its home goods division, which holds less than 4% of the UK market share. Sales in this category dropped by 15% in the fiscal year 2021, resulting in an operating loss of approximately £25 million.
| Business Unit | Market Share (%) | Yearly Sales (£ million) | Operating Loss (£ million) |
|---|---|---|---|
| Home Goods | 4 | £70 | £25 |
| Food (Non-Core Lines) | 5 | £90 | £15 |
This data illustrates the financial drain posed by these non-core segments, reinforcing the notion that they are prime candidates for divestiture or strategic reassessment.
Marks and Spencer Group plc - BCG Matrix: Question Marks
Within Marks and Spencer Group plc, the concept of Question Marks highlights specific product lines and initiatives that are in a growth phase but currently hold a low market share. The following sections explore this category in detail.
New Sustainability Initiatives
Marks and Spencer launched its “Plan A” sustainability initiative aimed at achieving significant environmental targets. In the fiscal year 2023, the company reported a commitment to reducing greenhouse gas emissions by 50% by 2025, moving towards becoming a net-zero business by 2040. However, the market share for their sustainable product lines remains below 10% of their overall sales.
Despite these low market shares, the demand for sustainable products is rising, with UK consumers increasingly prioritizing environmentally friendly options. In 2023, research indicated that 66% of consumers were willing to pay more for sustainable products, reflecting a significant potential for growth.
Emerging Fashion Trends Targeting Younger Audiences
Marks and Spencer has identified a gap in its offerings aimed at younger consumers, particularly in online fashion. In 2022, the company reported a 12% growth in online clothing sales, indicating an emerging opportunity. However, their overall share of the youth fashion market remains at approximately 8%, a clear indicator of a Question Mark status.
To address this, M&S introduced the “Billie & Blossom” collection, focusing on trendy, affordable pieces for millennials. The collection generated sales of £30 million in its first year, illustrating growth potential but still inadequate to elevate market share significantly.
International Market Expansion Efforts
Marks and Spencer has also sought to expand its presence in international markets, particularly in Asia and Europe. In 2023, the company reported international sales growth of 15%, driven by entry into markets like India and supply agreements in the Middle East. Despite this growth, M&S's international market share remains at around 5% of the total UK retail market.
A substantial investment of £100 million has been allocated for further international expansion, highlighting the company's strategic focus on increasing market presence. However, these efforts pose a financial burden, consuming significant cash resources without immediate return.
| Initiative | Market Share (%) | Sales Growth (%) | Investment (£ million) | Environmental Target |
|---|---|---|---|---|
| Sustainability Initiatives | 10 | - | - | 50% reduction by 2025 |
| Younger Audience Fashion | 8 | 12 | 30 | - |
| International Expansion | 5 | 15 | 100 | - |
In summary, Marks and Spencer's Question Marks category includes sustainability initiatives, new fashion lines aimed at younger audiences, and international market expansion efforts. While these areas show considerable growth potential, they also represent a significant investment risk, as the company must decide whether to continue funding these efforts or reassess their viability in the marketplace.
Marks and Spencer Group plc presents a fascinating case study within the BCG Matrix framework, showcasing a dynamic interplay of Stars, Cash Cows, Dogs, and Question Marks that highlights both its strengths and challenges in an evolving market landscape. As the company navigates the complexities of retail, understanding these categories will be vital for strategic positioning and sustained growth.
[right_small]Disclaimer
All information, articles, and product details provided on this website are for general informational and educational purposes only. We do not claim any ownership over, nor do we intend to infringe upon, any trademarks, copyrights, logos, brand names, or other intellectual property mentioned or depicted on this site. Such intellectual property remains the property of its respective owners, and any references here are made solely for identification or informational purposes, without implying any affiliation, endorsement, or partnership.
We make no representations or warranties, express or implied, regarding the accuracy, completeness, or suitability of any content or products presented. Nothing on this website should be construed as legal, tax, investment, financial, medical, or other professional advice. In addition, no part of this site—including articles or product references—constitutes a solicitation, recommendation, endorsement, advertisement, or offer to buy or sell any securities, franchises, or other financial instruments, particularly in jurisdictions where such activity would be unlawful.
All content is of a general nature and may not address the specific circumstances of any individual or entity. It is not a substitute for professional advice or services. Any actions you take based on the information provided here are strictly at your own risk. You accept full responsibility for any decisions or outcomes arising from your use of this website and agree to release us from any liability in connection with your use of, or reliance upon, the content or products found herein.