
|
MarketAxess Holdings Inc. (MKTX) DCF Valuation |
Fully Editable: Tailor To Your Needs In Excel Or Sheets
Professional Design: Trusted, Industry-Standard Templates
Investor-Approved Valuation Models
MAC/PC Compatible, Fully Unlocked
No Expertise Is Needed; Easy To Follow
MarketAxess Holdings Inc. (MKTX) Bundle
Discover the real potential of MarketAxess Holdings Inc. (MKTX) with our advanced DCF Calculator! Adjust key assumptions, explore various scenarios, and evaluate how different changes affect MarketAxess Holdings Inc. (MKTX) valuation – all within one comprehensive Excel template.
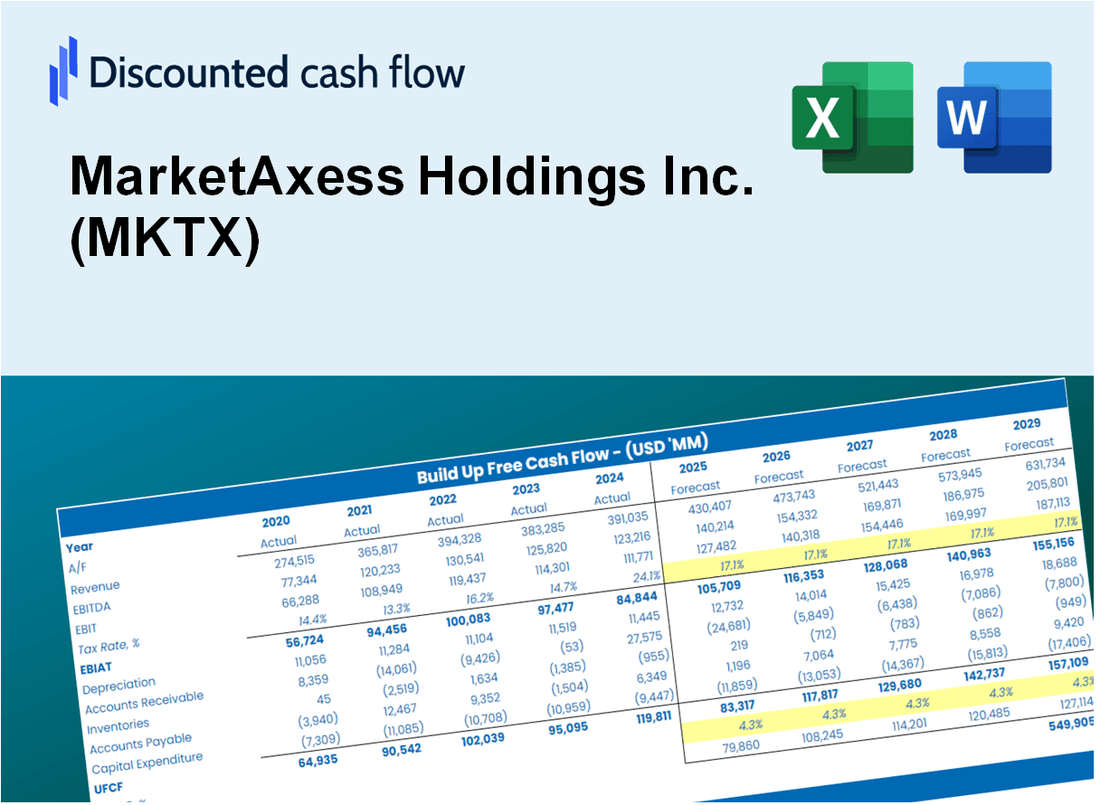
Discounted Cash Flow (DCF) - (USD MM)
| Year | AY1 2020 |
AY2 2021 |
AY3 2022 |
AY4 2023 |
AY5 2024 |
FY1 2025 |
FY2 2026 |
FY3 2027 |
FY4 2028 |
FY5 2029 |
|---|---|---|---|---|---|---|---|---|---|---|
| Revenue | 689.1 | 699.0 | 718.3 | 752.5 | 817.1 | 852.9 | 890.3 | 929.4 | 970.1 | 1,012.7 |
| Revenue Growth, % | 0 | 1.43 | 2.77 | 4.77 | 8.58 | 4.38 | 4.38 | 4.38 | 4.38 | 4.38 |
| EBITDA | 418.3 | 395.0 | 406.1 | 411.1 | 442.6 | 482.0 | 503.1 | 525.2 | 548.2 | 572.3 |
| EBITDA, % | 60.71 | 56.51 | 56.54 | 54.63 | 54.17 | 56.51 | 56.51 | 56.51 | 56.51 | 56.51 |
| Depreciation | 42.8 | 60.2 | 67.2 | 76.4 | 80.5 | 75.4 | 78.7 | 82.1 | 85.7 | 89.5 |
| Depreciation, % | 6.22 | 8.62 | 9.35 | 10.15 | 9.85 | 8.84 | 8.84 | 8.84 | 8.84 | 8.84 |
| EBIT | 375.5 | 334.8 | 339.0 | 334.7 | 362.1 | 406.6 | 424.5 | 443.1 | 462.5 | 482.8 |
| EBIT, % | 54.49 | 47.9 | 47.19 | 44.47 | 44.32 | 47.67 | 47.67 | 47.67 | 47.67 | 47.67 |
| Total Cash | 479.1 | 517.9 | 464.7 | 522.2 | 649.3 | 609.3 | 636.0 | 663.9 | 693.0 | 723.4 |
| Total Cash, percent | .0 | .0 | .0 | .0 | .0 | .0 | .0 | .0 | .0 | .0 |
| Account Receivables | 359.5 | 403.7 | 465.9 | 662.6 | 341.9 | 519.7 | 542.5 | 566.3 | 591.1 | 617.1 |
| Account Receivables, % | 52.17 | 57.75 | 64.86 | 88.05 | 41.85 | 60.93 | 60.93 | 60.93 | 60.93 | 60.93 |
| Inventories | .0 | .0 | .0 | .0 | .0 | .0 | .0 | .0 | .0 | .0 |
| Inventories, % | 0 | 0 | 0 | 0 | 0 | 0 | 0 | 0 | 0 | 0 |
| Accounts Payable | 44.4 | 71.2 | 55.3 | 37.0 | 37.3 | 57.7 | 60.2 | 62.8 | 65.6 | 68.5 |
| Accounts Payable, % | 6.44 | 10.19 | 7.69 | 4.92 | 4.57 | 6.76 | 6.76 | 6.76 | 6.76 | 6.76 |
| Capital Expenditure | -45.6 | -50.6 | -51.9 | -52.4 | -9.9 | -49.9 | -52.1 | -54.4 | -56.8 | -59.3 |
| Capital Expenditure, % | -6.62 | -7.24 | -7.22 | -6.97 | -1.22 | -5.85 | -5.85 | -5.85 | -5.85 | -5.85 |
| Tax Rate, % | 23.95 | 23.95 | 23.95 | 23.95 | 23.95 | 23.95 | 23.95 | 23.95 | 23.95 | 23.95 |
| EBITAT | 300.3 | 258.5 | 250.7 | 259.6 | 275.4 | 312.9 | 326.6 | 341.0 | 355.9 | 371.5 |
| Depreciation | ||||||||||
| Changes in Account Receivables | ||||||||||
| Changes in Inventories | ||||||||||
| Changes in Accounts Payable | ||||||||||
| Capital Expenditure | ||||||||||
| UFCF | -17.6 | 250.9 | 187.9 | 68.5 | 666.9 | 180.9 | 332.9 | 347.5 | 362.8 | 378.7 |
| WACC, % | 8.39 | 8.39 | 8.38 | 8.39 | 8.38 | 8.39 | 8.39 | 8.39 | 8.39 | 8.39 |
| PV UFCF | ||||||||||
| SUM PV UFCF | 1,239.4 | |||||||||
| Long Term Growth Rate, % | 2.00 | |||||||||
| Free cash flow (T + 1) | 386 | |||||||||
| Terminal Value | 6,049 | |||||||||
| Present Terminal Value | 4,044 | |||||||||
| Enterprise Value | 5,284 | |||||||||
| Net Debt | -472 | |||||||||
| Equity Value | 5,756 | |||||||||
| Diluted Shares Outstanding, MM | 38 | |||||||||
| Equity Value Per Share | 152.78 |
What You Will Get
- Real MKTX Financial Data: Pre-filled with MarketAxess’s historical and projected data for precise analysis.
- Fully Editable Template: Modify key inputs like revenue growth, WACC, and EBITDA % with ease.
- Automatic Calculations: See MarketAxess’s intrinsic value update instantly based on your changes.
- Professional Valuation Tool: Designed for investors, analysts, and consultants seeking accurate DCF results.
- User-Friendly Design: Simple structure and clear instructions for all experience levels.
Key Features
- Comprehensive DCF Calculator: Offers detailed unlevered and levered DCF valuation models tailored for MarketAxess Holdings Inc. (MKTX).
- WACC Calculator: Features a pre-built Weighted Average Cost of Capital sheet with customizable inputs specific to MKTX.
- Customizable Forecast Assumptions: Adjust growth rates, capital expenditures, and discount rates to fit the MarketAxess scenario.
- Integrated Financial Ratios: Evaluate profitability, leverage, and efficiency ratios pertinent to MarketAxess Holdings Inc. (MKTX).
- Interactive Dashboard and Charts: Visual representations summarize key valuation metrics for straightforward analysis of MKTX.
How It Works
- 1. Access the Template: Download and open the Excel file containing MarketAxess Holdings Inc.'s (MKTX) preloaded data.
- 2. Adjust Assumptions: Modify essential inputs such as growth rates, WACC, and capital expenditures.
- 3. View Results Instantly: The DCF model automatically calculates intrinsic value and NPV for MarketAxess Holdings Inc. (MKTX).
- 4. Explore Scenarios: Analyze different valuation outcomes by comparing multiple forecasts.
- 5. Present with Confidence: Share professional valuation insights to enhance your decision-making process.
Why Choose This Calculator for MarketAxess Holdings Inc. (MKTX)?
- Designed for Experts: A sophisticated tool utilized by traders, financial analysts, and investment managers.
- Accurate Data: MarketAxess’ historical and anticipated financials preloaded for precision.
- Dynamic Scenario Analysis: Effortlessly test various market conditions and assumptions.
- Comprehensive Outputs: Automatically computes intrinsic value, NPV, and essential metrics.
- User-Friendly: Detailed instructions walk you through each step of the process.
Who Should Use MarketAxess Holdings Inc. (MKTX)?
- Finance Students: Explore fixed-income trading strategies and apply them using real market data.
- Academics: Integrate advanced trading models into your research or teaching materials.
- Investors: Evaluate your investment strategies and analyze market trends related to MarketAxess Holdings Inc. (MKTX).
- Analysts: Enhance your analysis with a customizable trading platform tailored for fixed-income securities.
- Institutional Traders: Gain a deeper understanding of electronic trading and market liquidity through the lens of MarketAxess Holdings Inc. (MKTX).
What the Template Contains
- Pre-Filled Data: Includes MarketAxess Holdings Inc.'s historical financials and forecasts.
- Discounted Cash Flow Model: Editable DCF valuation model with automatic calculations.
- Weighted Average Cost of Capital (WACC): A dedicated sheet for calculating WACC based on custom inputs.
- Key Financial Ratios: Analyze MarketAxess's profitability, efficiency, and leverage.
- Customizable Inputs: Edit revenue growth, margins, and tax rates with ease.
- Clear Dashboard: Charts and tables summarizing key valuation results.
Disclaimer
All information, articles, and product details provided on this website are for general informational and educational purposes only. We do not claim any ownership over, nor do we intend to infringe upon, any trademarks, copyrights, logos, brand names, or other intellectual property mentioned or depicted on this site. Such intellectual property remains the property of its respective owners, and any references here are made solely for identification or informational purposes, without implying any affiliation, endorsement, or partnership.
We make no representations or warranties, express or implied, regarding the accuracy, completeness, or suitability of any content or products presented. Nothing on this website should be construed as legal, tax, investment, financial, medical, or other professional advice. In addition, no part of this site—including articles or product references—constitutes a solicitation, recommendation, endorsement, advertisement, or offer to buy or sell any securities, franchises, or other financial instruments, particularly in jurisdictions where such activity would be unlawful.
All content is of a general nature and may not address the specific circumstances of any individual or entity. It is not a substitute for professional advice or services. Any actions you take based on the information provided here are strictly at your own risk. You accept full responsibility for any decisions or outcomes arising from your use of this website and agree to release us from any liability in connection with your use of, or reliance upon, the content or products found herein.