
|
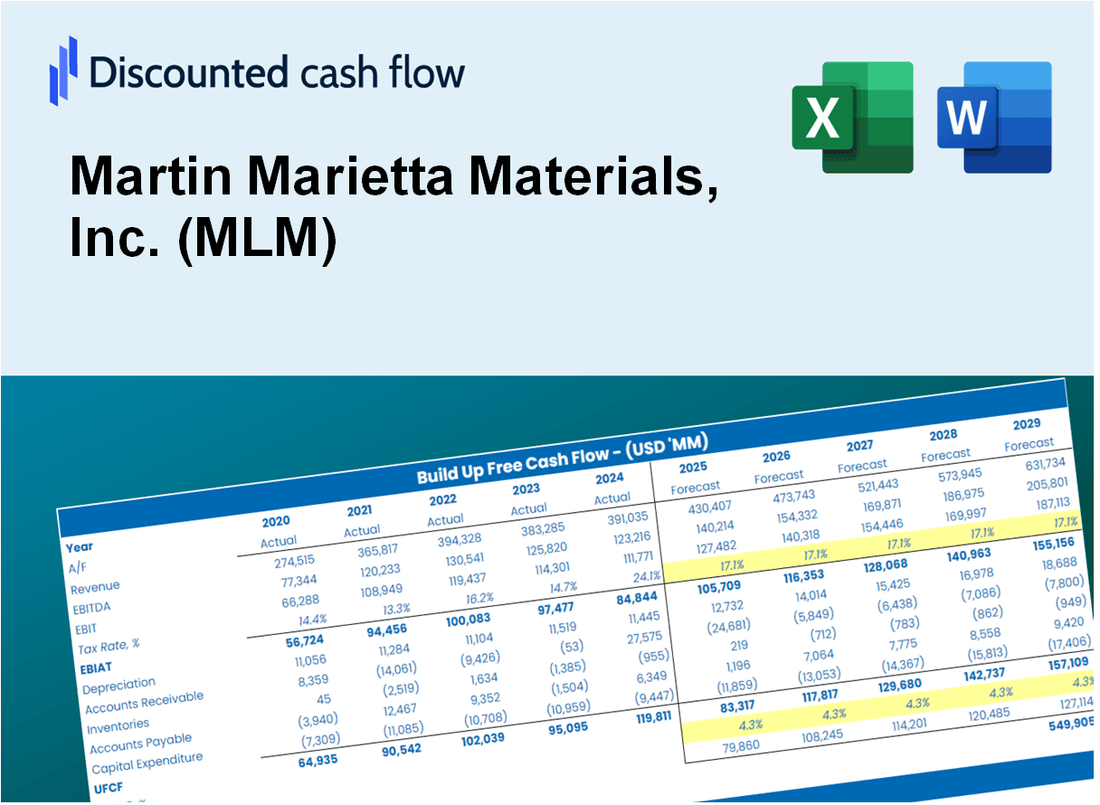
Martin Marietta Materials, Inc. (MLM) DCF Valuation |
Fully Editable: Tailor To Your Needs In Excel Or Sheets
Professional Design: Trusted, Industry-Standard Templates
Investor-Approved Valuation Models
MAC/PC Compatible, Fully Unlocked
No Expertise Is Needed; Easy To Follow
Martin Marietta Materials, Inc. (MLM) Bundle
Enhance your investment choices with the Martin Marietta Materials, Inc. (MLM) DCF Calculator! Explore authentic financial data, adjust growth projections and expenses, and instantly observe how these modifications affect the intrinsic value of Martin Marietta Materials, Inc. (MLM).
Discounted Cash Flow (DCF) - (USD MM)
| Year | AY1 2021 |
AY2 2022 |
AY3 2023 |
AY4 2024 |
AY5 2025 |
FY1 2026 |
FY2 2027 |
FY3 2028 |
FY4 2029 |
FY5 2030 |
|---|---|---|---|---|---|---|---|---|---|---|
| Revenue | 5,414.0 | 6,161.0 | 6,777.0 | 6,536.0 | 6,544.0 | 6,545.8 | 6,546.1 | 6,546.2 | 6,546.2 | 6,546.2 |
| Revenue Growth, % | 0 | 13.8 | 10 | -3.56 | 0.1224 | 0.02674703 | 0.00584485 | 0.00127724 | 0.000279105681 | 0.000060991085 |
| EBITDA | 1,449.9 | 1,766.0 | 2,171.0 | 3,338.0 | 2,154.0 | 2,390.4 | 2,613.8 | 2,825.0 | 3,024.9 | 3,214.0 |
| EBITDA, % | 26.78 | 28.66 | 32.03 | 51.07 | 32.92 | 36.52 | 39.93 | 43.15 | 46.21 | 49.1 |
| Depreciation | 451.7 | 506.0 | 513.0 | 573.0 | 637.0 | 658.8 | 680.3 | 701.8 | 723.2 | 744.5 |
| Depreciation, % | 8.34 | 8.21 | 7.57 | 8.77 | 9.73 | 10.06 | 10.39 | 10.72 | 11.05 | 11.37 |
| EBIT | 998.2 | 1,260.0 | 1,658.0 | 2,765.0 | 1,517.0 | 1,734.4 | 1,942.1 | 2,140.7 | 2,330.8 | 2,512.7 |
| EBIT, % | 18.44 | 20.45 | 24.47 | 42.3 | 23.18 | 26.5 | 29.67 | 32.7 | 35.61 | 38.38 |
| Total Cash | 258.4 | 358.0 | 1,272.0 | 670.0 | 67.0 | 531.9 | 531.9 | 531.9 | 531.9 | 531.9 |
| Total Cash, percent | .0 | .0 | .0 | .0 | .0 | .0 | .0 | .0 | .0 | .0 |
| Account Receivables | 774.0 | 785.9 | 753.0 | 678.0 | 723.0 | 780.1 | 780.1 | 780.1 | 780.1 | 780.1 |
| Account Receivables, % | 14.3 | 12.76 | 11.11 | 10.37 | 11.05 | 11.92 | 11.92 | 11.92 | 11.92 | 11.92 |
| Inventories | 752.6 | 873.7 | 989.0 | 1,115.0 | 1,078.0 | 1,129.9 | 1,181.0 | 1,231.6 | 1,281.8 | 1,331.4 |
| Inventories, % | 13.9 | 14.18 | 14.59 | 17.06 | 16.47 | 17.26 | 18.04 | 18.81 | 19.58 | 20.34 |
| Accounts Payable | 356.2 | 385.0 | 343.0 | 375.0 | .0 | 309.3 | 309.3 | 309.3 | 309.3 | 309.3 |
| Accounts Payable, % | 6.58 | 6.25 | 5.06 | 5.74 | 0 | 4.73 | 4.73 | 4.73 | 4.73 | 4.73 |
| Capital Expenditure | -423.1 | -482.0 | -650.0 | -855.0 | -807.0 | -663.0 | -663.0 | -663.0 | -663.0 | -663.0 |
| Capital Expenditure, % | -7.81 | -7.82 | -9.59 | -13.08 | -12.33 | -10.13 | -10.13 | -10.13 | -10.13 | -10.13 |
| Tax Rate, % | 11.72 | 11.72 | 11.72 | 11.72 | 11.72 | 11.72 | 11.72 | 11.72 | 11.72 | 11.72 |
| EBITAT | 819.7 | 1,001.3 | 1,298.2 | 2,124.9 | 1,339.2 | 1,404.9 | 1,573.1 | 1,734.0 | 1,888.0 | 2,035.3 |
| Depreciation | ||||||||||
| Changes in Account Receivables | ||||||||||
| Changes in Inventories | ||||||||||
| Changes in Accounts Payable | ||||||||||
| Capital Expenditure | ||||||||||
| UFCF | -322.1 | 921.1 | 1,036.8 | 1,823.9 | 786.2 | 1,601.0 | 1,539.2 | 1,722.2 | 1,898.0 | 2,067.1 |
| WACC, % | 8.43 | 8.41 | 8.41 | 8.4 | 8.46 | 8.42 | 8.42 | 8.42 | 8.42 | 8.42 |
| PV UFCF | ||||||||||
| SUM PV UFCF | 6,890.5 | |||||||||
| Long Term Growth Rate, % | 3.50 | |||||||||
| Free cash flow (T + 1) | 2,139 | |||||||||
| Terminal Value | 43,472 | |||||||||
| Present Terminal Value | 29,016 | |||||||||
| Enterprise Value | 35,906 | |||||||||
| Net Debt | 5,256 | |||||||||
| Equity Value | 30,650 | |||||||||
| Diluted Shares Outstanding, MM | 61 | |||||||||
| Equity Value Per Share | 506.61 |
What You Will Get
- Real Martin Marietta Data: Preloaded financials – from revenue to EBIT – based on actual and projected figures.
- Full Customization: Adjust all critical parameters (yellow cells) like WACC, growth %, and tax rates.
- Instant Valuation Updates: Automatic recalculations to analyze the impact of changes on Martin Marietta's fair value.
- Versatile Excel Template: Tailored for quick edits, scenario testing, and detailed projections.
- Time-Saving and Accurate: Skip building models from scratch while maintaining precision and flexibility.
Key Features
- Customizable Forecast Inputs: Adjust essential parameters such as revenue growth, EBITDA %, and capital expenditures tailored to Martin Marietta Materials, Inc. (MLM).
- Instant DCF Valuation: Quickly computes intrinsic value, NPV, and other key metrics automatically.
- High-Precision Accuracy: Leverages Martin Marietta's actual financial data for reliable valuation results.
- Effortless Scenario Analysis: Easily explore various assumptions and evaluate different outcomes.
- Time-Efficient Solution: Avoid the hassle of constructing complex valuation models from the ground up.
How It Works
- Step 1: Download the prebuilt Excel template with Martin Marietta Materials, Inc. (MLM) data included.
- Step 2: Explore the pre-filled sheets and familiarize yourself with the key metrics.
- Step 3: Update forecasts and assumptions in the editable yellow cells (WACC, growth, margins).
- Step 4: Instantly view recalculated results, including Martin Marietta's intrinsic value.
- Step 5: Make informed investment decisions or generate reports using the outputs.
Why Choose This Calculator for Martin Marietta Materials, Inc. (MLM)?
- User-Friendly Interface: Tailored for both novices and seasoned professionals.
- Customizable Inputs: Adjust parameters easily to suit your specific analysis.
- Real-Time Valuation: Observe immediate updates to Martin Marietta's valuation with input changes.
- Pre-Configured Data: Comes with Martin Marietta’s actual financial metrics for swift evaluations.
- Relied Upon by Experts: Utilized by investors and analysts for making well-informed choices.
Who Should Use This Product?
- Investors: Accurately assess Martin Marietta Materials’ fair value before making investment choices.
- CFOs: Utilize a top-tier DCF model for comprehensive financial reporting and analysis.
- Consultants: Efficiently customize the template for valuation reports tailored for clients.
- Entrepreneurs: Acquire insights into financial modeling practices employed by leading companies in the industry.
- Educators: Implement it as a teaching resource to illustrate valuation techniques.
What the Template Contains
- Comprehensive DCF Model: Editable template with detailed valuation calculations tailored for Martin Marietta Materials, Inc. (MLM).
- Real-World Data: Martin Marietta’s historical and projected financials preloaded for thorough analysis.
- Customizable Parameters: Adjust WACC, growth rates, and tax assumptions to explore various scenarios.
- Financial Statements: Complete annual and quarterly breakdowns for enhanced insights.
- Key Ratios: Integrated analysis for profitability, efficiency, and leverage metrics.
- Dashboard with Visual Outputs: Charts and tables providing clear, actionable results.
Disclaimer
All information, articles, and product details provided on this website are for general informational and educational purposes only. We do not claim any ownership over, nor do we intend to infringe upon, any trademarks, copyrights, logos, brand names, or other intellectual property mentioned or depicted on this site. Such intellectual property remains the property of its respective owners, and any references here are made solely for identification or informational purposes, without implying any affiliation, endorsement, or partnership.
We make no representations or warranties, express or implied, regarding the accuracy, completeness, or suitability of any content or products presented. Nothing on this website should be construed as legal, tax, investment, financial, medical, or other professional advice. In addition, no part of this site—including articles or product references—constitutes a solicitation, recommendation, endorsement, advertisement, or offer to buy or sell any securities, franchises, or other financial instruments, particularly in jurisdictions where such activity would be unlawful.
All content is of a general nature and may not address the specific circumstances of any individual or entity. It is not a substitute for professional advice or services. Any actions you take based on the information provided here are strictly at your own risk. You accept full responsibility for any decisions or outcomes arising from your use of this website and agree to release us from any liability in connection with your use of, or reliance upon, the content or products found herein.