
|
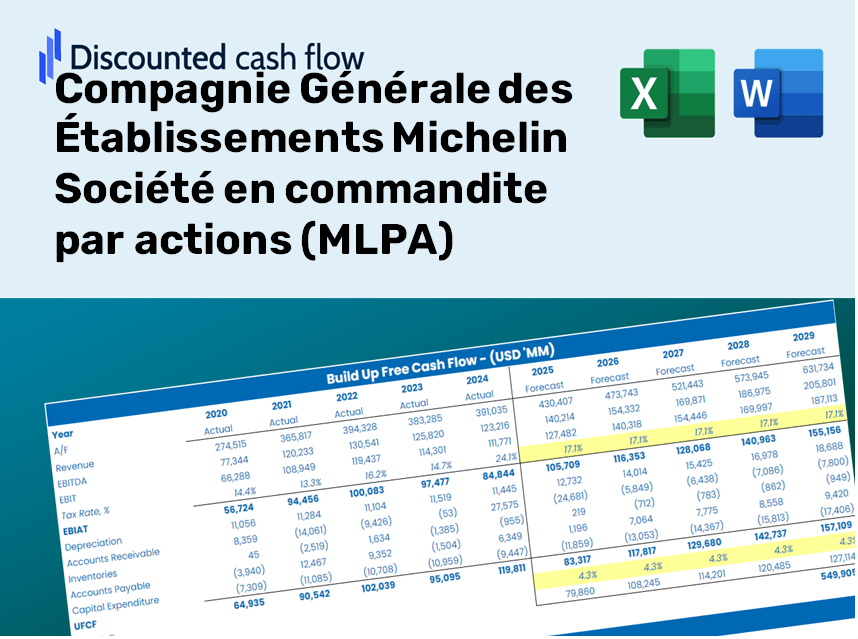
Compagnie Générale des Établissements Michelin Société en commandite par actions (ML.PA) DCF Valuation |
Fully Editable: Tailor To Your Needs In Excel Or Sheets
Professional Design: Trusted, Industry-Standard Templates
Investor-Approved Valuation Models
MAC/PC Compatible, Fully Unlocked
No Expertise Is Needed; Easy To Follow
Compagnie Générale des Établissements Michelin Société en commandite par actions (ML.PA) Bundle
Harness the power of valuation analysis for Compagnie Générale des Établissements Michelin Société en commandite par actions (MLPA) with our sophisticated DCF Calculator! This Excel template comes preloaded with real (MLPA) data, enabling you to adjust forecasts and assumptions to accurately calculate the intrinsic value of Compagnie Générale des Établissements Michelin (MLPA).
Discounted Cash Flow (DCF) - (USD MM)
| Year | AY1 2020 |
AY2 2021 |
AY3 2022 |
AY4 2023 |
AY5 2024 |
FY1 2025 |
FY2 2026 |
FY3 2027 |
FY4 2028 |
FY5 2029 |
|---|---|---|---|---|---|---|---|---|---|---|
| Revenue | 20,469.0 | 23,795.0 | 28,590.0 | 28,343.0 | 27,193.0 | 29,333.0 | 31,641.4 | 34,131.5 | 36,817.6 | 39,715.0 |
| Revenue Growth, % | 0 | 16.25 | 20.15 | -0.86394 | -4.06 | 7.87 | 7.87 | 7.87 | 7.87 | 7.87 |
| EBITDA | 3,173.0 | 4,544.0 | 4,898.0 | 4,885.0 | 4,391.0 | 4,993.2 | 5,386.2 | 5,810.0 | 6,267.3 | 6,760.5 |
| EBITDA, % | 15.5 | 19.1 | 17.13 | 17.24 | 16.15 | 17.02 | 17.02 | 17.02 | 17.02 | 17.02 |
| Depreciation | 1,840.0 | 1,812.0 | 1,944.0 | 2,008.0 | 1,760.0 | 2,168.3 | 2,339.0 | 2,523.1 | 2,721.6 | 2,935.8 |
| Depreciation, % | 8.99 | 7.62 | 6.8 | 7.08 | 6.47 | 7.39 | 7.39 | 7.39 | 7.39 | 7.39 |
| EBIT | 1,333.0 | 2,732.0 | 2,954.0 | 2,877.0 | 2,631.0 | 2,824.9 | 3,047.2 | 3,287.0 | 3,545.7 | 3,824.7 |
| EBIT, % | 6.51 | 11.48 | 10.33 | 10.15 | 9.68 | 9.63 | 9.63 | 9.63 | 9.63 | 9.63 |
| Total Cash | 4,747.0 | 4,482.0 | 2,584.0 | 2,800.0 | 4,027.0 | 4,444.1 | 4,793.9 | 5,171.1 | 5,578.1 | 6,017.1 |
| Total Cash, percent | .0 | .0 | .0 | .0 | .0 | .0 | .0 | .0 | .0 | .0 |
| Account Receivables | 3,582.0 | 4,197.0 | 5,046.0 | 4,876.0 | 3,766.0 | 4,918.6 | 5,305.6 | 5,723.2 | 6,173.6 | 6,659.4 |
| Account Receivables, % | 17.5 | 17.64 | 17.65 | 17.2 | 13.85 | 16.77 | 16.77 | 16.77 | 16.77 | 16.77 |
| Inventories | 4,058.0 | 5,256.0 | 6,479.0 | 5,447.0 | 5,699.0 | 6,145.3 | 6,629.0 | 7,150.6 | 7,713.4 | 8,320.4 |
| Inventories, % | 19.83 | 22.09 | 22.66 | 19.22 | 20.96 | 20.95 | 20.95 | 20.95 | 20.95 | 20.95 |
| Accounts Payable | 2,291.0 | 3,174.0 | 3,416.0 | 3,605.0 | 3,775.0 | 3,700.7 | 3,992.0 | 4,306.1 | 4,645.0 | 5,010.5 |
| Accounts Payable, % | 11.19 | 13.34 | 11.95 | 12.72 | 13.88 | 12.62 | 12.62 | 12.62 | 12.62 | 12.62 |
| Capital Expenditure | -1,375.0 | -1,705.0 | -2,141.0 | -2,236.0 | -2,265.0 | -2,205.3 | -2,378.8 | -2,566.0 | -2,767.9 | -2,985.8 |
| Capital Expenditure, % | -6.72 | -7.17 | -7.49 | -7.89 | -8.33 | -7.52 | -7.52 | -7.52 | -7.52 | -7.52 |
| Tax Rate, % | 22.94 | 22.94 | 22.94 | 22.94 | 22.94 | 22.94 | 22.94 | 22.94 | 22.94 | 22.94 |
| EBITAT | 772.2 | 1,983.4 | 2,177.1 | 2,291.2 | 2,027.3 | 2,039.1 | 2,199.6 | 2,372.7 | 2,559.4 | 2,760.8 |
| Depreciation | ||||||||||
| Changes in Account Receivables | ||||||||||
| Changes in Inventories | ||||||||||
| Changes in Accounts Payable | ||||||||||
| Capital Expenditure | ||||||||||
| UFCF | -4,111.8 | 1,160.4 | 150.1 | 3,454.2 | 2,550.3 | 329.0 | 1,580.3 | 1,704.7 | 1,838.8 | 1,983.6 |
| WACC, % | 6.63 | 6.77 | 6.78 | 6.84 | 6.82 | 6.77 | 6.77 | 6.77 | 6.77 | 6.77 |
| PV UFCF | ||||||||||
| SUM PV UFCF | 5,939.6 | |||||||||
| Long Term Growth Rate, % | 2.00 | |||||||||
| Free cash flow (T + 1) | 2,023 | |||||||||
| Terminal Value | 42,420 | |||||||||
| Present Terminal Value | 30,573 | |||||||||
| Enterprise Value | 36,513 | |||||||||
| Net Debt | 3,632 | |||||||||
| Equity Value | 32,881 | |||||||||
| Diluted Shares Outstanding, MM | 717 | |||||||||
| Equity Value Per Share | 45.86 |
Benefits You Will Receive
- Pre-Populated Financial Model: Access to Michelin’s actual data for accurate DCF valuation.
- Comprehensive Forecast Control: Modify revenue growth, profit margins, cost of capital, and other essential variables.
- Real-Time Calculations: Immediate updates allow you to view results as adjustments are made.
- Investor-Ready Framework: A polished Excel template crafted for high-quality valuation.
- Flexible and Reusable: Designed for adaptability, enabling continued use for in-depth forecasting.
Key Features
- 🔍 Real-Life MLPA Financials: Pre-filled historical and projected data for Compagnie Générale des Établissements Michelin.
- ✏️ Fully Customizable Inputs: Adjust all critical parameters (yellow cells) including WACC, growth %, and tax rates.
- 📊 Professional DCF Valuation: Built-in formulas calculate Michelin’s intrinsic value using the Discounted Cash Flow method.
- ⚡ Instant Results: Visualize Michelin’s valuation instantly after making adjustments.
- Scenario Analysis: Test and compare outcomes for various financial assumptions side-by-side.
How It Functions
- Download: Obtain the pre-configured Excel file containing Michelin's financial data.
- Customize: Modify key forecasts such as revenue growth, EBITDA %, and WACC.
- Update Automatically: Enjoy real-time updates for intrinsic value and NPV calculations.
- Test Scenarios: Generate various projections and analyze results side by side.
- Make Decisions: Leverage the valuation insights to inform your investment approach.
Why Choose This Calculator for Michelin (MLPA)?
- Precision: Utilizes genuine Michelin financial data to ensure accuracy.
- Adaptability: Crafted for users to easily test and adjust inputs as needed.
- Efficiency: Eliminate the challenges of constructing a DCF model from the ground up.
- Expert-Level: Built with the accuracy and usability expected by CFOs.
- Intuitive: User-friendly design that accommodates individuals without extensive financial modeling expertise.
Who Should Use This Product?
- Individual Investors: Make informed decisions regarding the purchase or sale of Michelin stock (MLPA).
- Financial Analysts: Enhance valuation methods with ready-to-implement financial models specific to Michelin (MLPA).
- Consultants: Provide clients with accurate and timely valuation insights on Michelin (MLPA).
- Business Owners: Gain insights into the valuation of major companies like Michelin (MLPA) to inform your own business strategies.
- Finance Students: Learn effective valuation techniques by analyzing real-world data and case studies involving Michelin (MLPA).
Contents of the Template
- Historical Data: Comprises Michelin’s previous financial records and foundational forecasts.
- DCF and Levered DCF Models: Comprehensive templates for assessing Michelin’s intrinsic value.
- WACC Sheet: Pre-configured calculations for the Weighted Average Cost of Capital.
- Editable Inputs: Adjust essential drivers such as growth rates, EBITDA percentages, and CAPEX assumptions.
- Quarterly and Annual Statements: A full analysis of Michelin’s financials.
- Interactive Dashboard: Dynamically visualize valuation outcomes and projections.
Disclaimer
All information, articles, and product details provided on this website are for general informational and educational purposes only. We do not claim any ownership over, nor do we intend to infringe upon, any trademarks, copyrights, logos, brand names, or other intellectual property mentioned or depicted on this site. Such intellectual property remains the property of its respective owners, and any references here are made solely for identification or informational purposes, without implying any affiliation, endorsement, or partnership.
We make no representations or warranties, express or implied, regarding the accuracy, completeness, or suitability of any content or products presented. Nothing on this website should be construed as legal, tax, investment, financial, medical, or other professional advice. In addition, no part of this site—including articles or product references—constitutes a solicitation, recommendation, endorsement, advertisement, or offer to buy or sell any securities, franchises, or other financial instruments, particularly in jurisdictions where such activity would be unlawful.
All content is of a general nature and may not address the specific circumstances of any individual or entity. It is not a substitute for professional advice or services. Any actions you take based on the information provided here are strictly at your own risk. You accept full responsibility for any decisions or outcomes arising from your use of this website and agree to release us from any liability in connection with your use of, or reliance upon, the content or products found herein.