
|
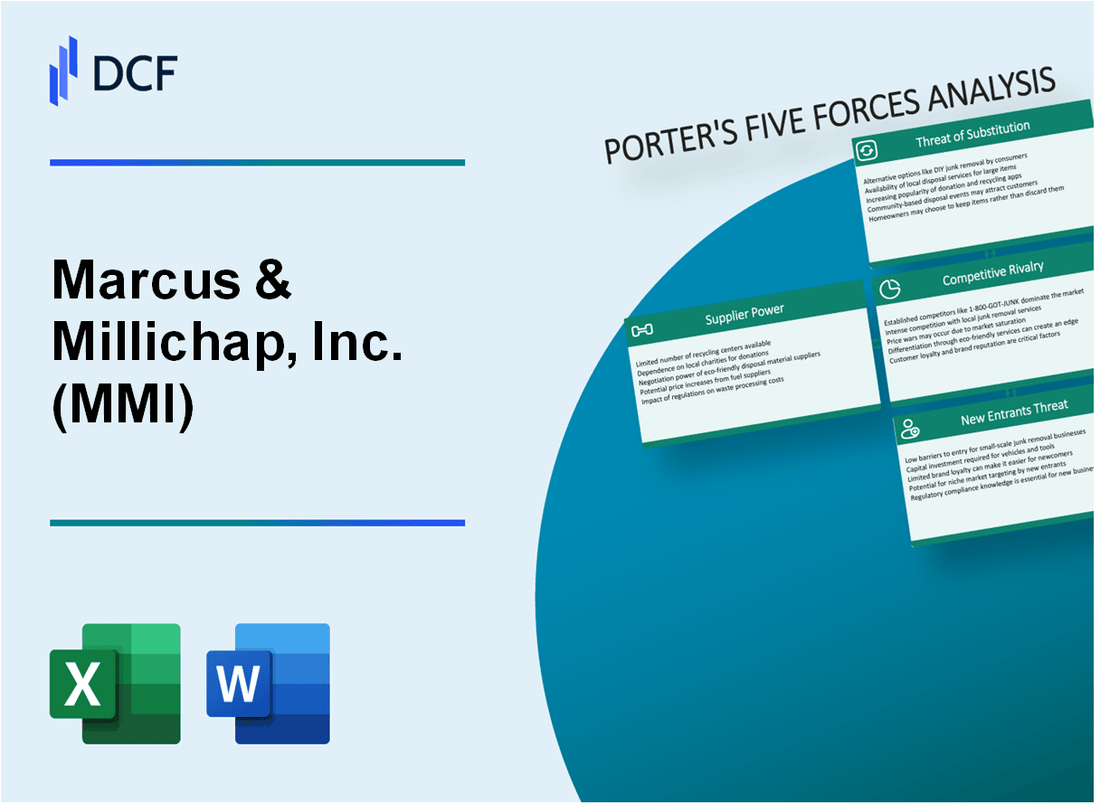
Marcus & Millichap, Inc. (MMI): 5 FORCES Analysis [Nov-2025 Updated] |
Fully Editable: Tailor To Your Needs In Excel Or Sheets
Professional Design: Trusted, Industry-Standard Templates
Investor-Approved Valuation Models
MAC/PC Compatible, Fully Unlocked
No Expertise Is Needed; Easy To Follow
Marcus & Millichap, Inc. (MMI) Bundle
You're looking at a commercial real estate brokerage that's showing real grit in this tough cycle. Honestly, even with market headwinds, this firm posted a $193.9 million revenue in Q3 2025 and managed a 15.1% growth, suggesting they're taking share from competitors. To figure out how they're pulling that off-who's holding the power, from their brokers to their clients-we need to map out the battlefield using Porter's Five Forces. Dive in below for the precise breakdown of supplier leverage, customer clout, rivalry intensity, and the threats shaping their next move.
Marcus & Millichap, Inc. (MMI) - Porter's Five Forces: Bargaining power of suppliers
You're analyzing the supplier side for Marcus & Millichap, Inc. (MMI), and the reality is stark: the brokers are the entire show. In this business model, the agents are not just employees; they are the primary revenue generators whose compensation structure dictates the firm's largest expense category. This dynamic gives them significant leverage.
Brokers are the key supplier, driving MMI's 62.4% Q3 2025 cost of services. This figure, representing the portion of revenue paid out to the agents and related costs, is the clearest indicator of supplier power. For the nine months ending September 30, 2025, the cost of services as a percentage of total revenues was slightly lower at 61.8%, though still representing the vast majority of operating expenses. The increase in this percentage for the quarter was primarily driven by year-over-year revenue growth that pushed producers into higher commission tiers.
The financial reality of this supplier relationship is laid out below:
| Metric | Period | Value | Context |
|---|---|---|---|
| Cost of Services (% of Total Revenue) | Q3 2025 | 62.4% | Direct measure of supplier cost for the quarter |
| Cost of Services (% of Total Revenue) | Nine Months Ended Sep 30, 2025 | 61.8% | Year-to-date supplier cost |
| Increase in Average Commission Rate | Q3 2025 vs. Q3 2024 | 28 basis points | Indicates broker pricing power on transactions |
| Increase in Average Commission Rate | Nine Months Ended Sep 30, 2025 vs. Prior Year | 2% | Year-to-date commission rate growth |
High demand for top talent forces investment in retention and compensation. When transaction volume is up, as seen by the 19.2% increase in the total number of transactions in Q3 2025, the cost to the firm scales almost immediately because the revenue is tied directly to the broker's payout. This means that to capture market share, Marcus & Millichap, Inc. must compete aggressively on the split, which directly impacts profitability. The rising average commission rate of 28 basis points in Q3 2025 shows brokers successfully commanded a greater share of the revenue pie.
Total professionals slightly decreased to 1,669 as of Q3 2025, increasing individual broker power. The total count of investment sales and financing professionals stood at 1,669 as of September 30, 2025, down from 1,678 at the end of the same period last year. Furthermore, the firm saw a 3.6% reduction in the number of sales professionals over the first nine months of 2025. When the total pool of producers shrinks while transaction volume grows, the remaining individuals, especially the high-performers, gain leverage. You see this efficiency gain in the numbers, though: average transactions per sales professional increased to 2.65 in the first nine months of 2025 from 2.29 in the same period in 2024.
Star brokers have high switching power due to portable client relationships. This is the core risk of the brokerage model. A top producer's client list is theirs, not Marcus & Millichap, Inc.'s. If a star broker leaves for a competitor, they take their revenue stream with them, making retention a constant, high-stakes negotiation. This portability means Marcus & Millichap, Inc. has limited ability to suppress commission rates for its most valuable assets.
MMI's brand and research platform somewhat mitigates broker leverage. The firm attempts to counterbalance this individual power through its institutional infrastructure. The brand recognition, which allows Marcus & Millichap, Inc. to attract new talent and provide a platform for deals, is a non-portable asset. Also, the proprietary research platform provides deal flow and market intelligence that is harder for an individual to replicate independently. Still, the 62.4% cost of services in Q3 2025 suggests this mitigation is only partial; the broker's share remains dominant.
- The Private Client Market, which generally earns higher commissions, saw its revenue increase by 16.9% in Q3 2025.
- Financing fees revenue increased by 27.7% in Q3 2025, driven by a 34.4% increase in total financing volume.
- The company's market capitalization stood at $1.15 billion in Q3 2025.
Finance: draft a sensitivity analysis on a 100 basis point increase in the average commission rate by next Tuesday.
Marcus & Millichap, Inc. (MMI) - Porter's Five Forces: Bargaining power of customers
The bargaining power of customers for Marcus & Millichap, Inc. (MMI) is assessed as moderate. This power is largely influenced by investor sentiment, which, as of late 2025, is showing signs of recovery but remains tethered to the cost of capital. While the five-year Treasury rate stabilized in the mid-3% range in the third quarter of 2025, the preceding period of high interest rates fostered significant investor caution, giving buyers leverage to negotiate terms and pricing.
A key factor limiting the power of any single, large customer is MMI's strategic focus on the Private Client Market segment. This segment, typically defined as transactions valued between $1 million and $10 million, is the most active part of the commercial real estate market, historically accounting for over 80%+ of U.S. transactions. For MMI specifically, the Private Client business was dominant, contributing 64% of brokerage revenue year-to-date, totaling $274 million over the first nine months of 2025. This high concentration in smaller, relationship-driven deals means that while the customer base is broad, individual transaction sizes are limited, which generally caps the leverage any one client can exert.
Evidence suggests customers have been able to delay transactions or force price concessions. In the third quarter of 2025, MMI saw a 19.2% increase in the total number of transactions closed, yet the total sales volume for the quarter actually decreased by 2.0% compared to the third quarter of 2024. This divergence-more deals but lower total dollar volume-implies that investors were either holding out for better pricing or executing on smaller, less capital-intensive deals, effectively delaying larger commitments until valuation certainty improved.
Customers are currently benefiting from a market-wide trend of narrowing bid/ask spreads. This convergence between buyer expectations and seller pricing, driven by stabilizing financing costs, forces brokers like Marcus & Millichap to adjust pricing expectations downward to secure closings. CEO Hessam Nadji noted that improved bid/ask spreads contributed to revenue growth in Q3 2025.
Conversely, Marcus & Millichap works to increase switching costs through its integrated service model. The firm's Research & Advisory services support client dialogue, financing, and sales execution. While this revenue stream is small compared to core brokerage, it embeds the firm deeper into the client's decision-making process. Other revenue, which includes advisory fees, was $5 million in Q3 2025, down from $6 million in Q3 2024, and totaled $13 million for the nine-month period.
Here is a look at the financial scale of the customer-facing segments for Marcus & Millichap in Q3 2025:
| Metric | Q3 2025 Amount | Year-over-Year Change |
|---|---|---|
| Total Revenue | $194.0 million | Up 15% |
| Brokerage Commission Revenue | $162.2 million | Up 14.2% |
| Private Client Brokerage Revenue Share (Q3) | 63% | Up from 62% (Q3 2024) |
| Financing Revenue | $26.3 million | Up 27.7% |
| Other Revenue (Advisory/Consulting) | $5.0 million | Down from $6.0 million |
The reliance on the Private Client segment creates a specific dynamic for customer power, which can be summarized by the following points:
- Private Client revenue for the first nine months was $274 million, representing 64% of total brokerage revenue.
- The average transaction size year-to-date was $5.6 million, down from $5.8 million a year prior.
- Q3 2025 saw a 19.2% increase in transaction count, but a 2.0% decrease in total sales volume.
- Financing volume grew 34.4% in Q3 2025, indicating customer demand for capital solutions was strong.
- The firm's overall transaction volume for Q3 2025 was $8.4 billion across nearly 1,600 transactions.
Marcus & Millichap, Inc. (MMI) - Porter's Five Forces: Competitive rivalry
You're looking at a crowded field where Marcus & Millichap, Inc. (MMI) competes directly against established giants. The rivalry is definitely high because you are up against large, publicly traded national firms. To put this into perspective, consider the scale differences based on recent reported revenues:
| Competitor | Reported Revenue Figure |
|---|---|
| CBRE Group Inc | $35.8B |
| Jones Lang LaSalle Inc | $23.4B |
| Newmark Group Inc | $2.7B |
| Marcus & Millichap, Inc. (Q3 2025 Total Revenue) | $193.9 million |
Honestly, the sheer revenue disparity shows the scale of the competition in the broader commercial real estate services market. Still, Marcus & Millichap, Inc. carves out its strength in a specific niche, which is key to understanding its position.
Marcus & Millichap, Inc. dominates the Private Client segment. This focus is where the firm shows its competitive edge against the larger players who often prioritize institutional deals. For the third quarter of 2025, the Private Client Market brokerage revenue was $102.3 million, representing a 16.9% increase year-over-year. This segment accounted for 63% of total brokerage revenue in Q3 2025, up from 62% in Q3 2024. That concentration is a strategic advantage when dealing with smaller, more numerous transactions.
The industry itself is cyclical, and market disruption certainly increases the heat for every deal that comes to market. You know how it is; when transaction volume is tight, everyone fights harder for the available mandates. For instance, the bid-ask gap between buyers and sellers, which was widest in 2022-2023, has narrowed in 2025. Still, overall market activity remains about 15-20% below pre-pandemic levels. Navigating this environment requires superior execution, so let's look at how Marcus & Millichap, Inc. performed.
Despite the headwinds, Marcus & Millichap, Inc.'s performance suggests market share gains versus peers. Total revenue for Q3 2025 grew by 15.1% compared to Q3 2024, reaching $193.9 million. Brokerage commissions revenue specifically increased by 14.2%. CEO Hessam Nadji noted that Marcus & Millichap, Inc.'s transaction growth was 25%, significantly outpacing the estimated market growth of 12%. That's a clear indicator of winning more business than the market is growing.
Competition intensifies in the Middle Market as Marcus & Millichap, Inc. actively expands its Institutional Property Advisors (IPA) division to capture larger deals. While the Private Client segment is the core, the push into larger transactions is where the rivalry with firms like CBRE and JLL is most direct. For the nine months ending in 2025, the Middle Market and Larger Transaction Market brokerage revenue was $135.6 million, showing a 7.6% increase. In Q3 2025 alone, this segment brought in $52.5 million, a 6.5% year-over-year increase. To support this expansion, Marcus & Millichap, Inc. is bringing in experienced leadership for IPA:
- Hiring Andrew Leahy as Senior Vice President, National Director of IPA's multifamily division.
- Adding Dags Chen as the new Head of IPA Research.
These moves show a direct effort to bolster capabilities in the institutional space, which is a key battleground with the largest competitors.
Marcus & Millichap, Inc. (MMI) - Porter's Five Forces: Threat of substitutes
You're looking at how outside forces could replace the core service Marcus & Millichap, Inc. (MMI) provides-connecting buyers and sellers of commercial property. The threat here isn't one single entity; it's a collection of channels that bypass the traditional brokerage model.
Direct sales by large institutional investors bypassing brokers remain a constant pressure point. While institutional capital is reemerging in select markets, with US investment sales hitting $182.4B in H1 2025 (up over 25% year-over-year), private buyers dominated nationally during that same period. Institutional investors surveyed plan to keep their target real estate allocation flat at an average of 10.7% for 2025, down from 10.8% the prior year, even though their collective real estate investments total approximately $1.4 trillion. For MMI, whose Private Client Market (transactions between $1M and $10M) accounted for 64% of their Q1-Q3 2025 transactions, the institutional segment is a smaller, but still relevant, competitive space.
Commercial real estate auction platforms present a growing substitute channel, offering speed and transparency. The global auction market was valued at an estimated $35 billion in 2024. Online auctions, which are a key component of this threat, are forecasted to grow at a Compound Annual Growth Rate (CAGR) of 12.36%. This digital shift is significant, as online-only auction sales grew by about 14% in value.
Here's a quick comparison of the scale of the auction market versus the broader private fund space:
| Market Segment | Reported Value/Size | Relevant Year/Period |
| Global Auction Market Size | $35 billion | 2024 |
| Global Private-Market Assets (AUM) | Surpassed $15 trillion | 2025 |
| Global Network Auction Platforms Market | US$ 361 million | 2024 |
| Assets in Semiliquid Funds (incl. Nontraded REITs) | Almost $450 billion | June 2025 |
Technology platforms and Artificial Intelligence (AI) are digitizing parts of the transaction, which compresses commission rates. Startups are leveraging AI to streamline valuation, market analysis, and legal document processing, leading to lower costs passed onto consumers and forcing established players to adapt. For Marcus & Millichap, Inc., which reported brokerage commissions as 84% of consolidated revenue in the first nine months of 2025, this technological pressure is direct. AI is seen as a power tool to enhance productivity, not replace brokers entirely, by focusing agents on high-value work.
- AI cuts the time needed to analyze sprawling datasets.
- AI enhances risk assessment for investment decisions.
- AI automates leasing workflows via virtual assistants.
- Office vacancy in 2025 stands at 18.8%.
The complexity of commercial transactions, particularly tax-deferred exchanges, still limits full substitution. While the 1031 Exchange volume fell to $11.9 billion in 2024, the rules remain intact following the One Big Beautiful Bill Act, meaning no cap on deferrals above $500,000. This certainty is expected to drive an increase in 1031 transactional volume in 2025. The need for expertise in structuring these complex, tax-sensitive deals keeps the traditional brokerage service essential for many investors.
Alternative investment vehicles like Real Estate Investment Trusts (REITs) and private funds offer indirect property exposure, pulling capital away from direct brokerage services. Global private-market assets have surpassed $15 trillion. Specifically, assets in semiliquid funds, which include nontraded REITs, totaled almost $450 billion through June 2025, marking a 16% increase from 2024. In Q1 2025, Private placement NAV REITs posted a 1.2% total return.
Marcus & Millichap, Inc. (MMI) - Porter's Five Forces: Threat of new entrants
The barrier to entry for a national, full-service brokerage like Marcus & Millichap, Inc. (MMI) is high, primarily due to established brand recognition and the scale required to compete across diverse US markets. As of June 30, 2025, Marcus & Millichap, Inc. maintained a geographic defense with more than 80 offices across the United States and Canada, supported by 1,640 investment sales and financing professionals. The outline suggests a figure of 1,669 professionals, which is close to the 1,712 reported at the end of 2024. This scale allows for economies of scope and a national marketing reach that smaller firms struggle to match immediately.
Marcus & Millichap, Inc.'s capital-light model, heavily reliant on a large, commission-based sales force, is difficult to replicate quickly. The cost structure is weighted towards variable expenses, mainly commissions paid to specialists. In Q3 2025, 84% of total revenue, or $162.2 million, came from real estate brokerage commissions. Building a comparable sales force requires significant time and investment in recruiting and training, even if the fixed overhead is relatively lower than an asset-heavy model. The firm's efficiency is shown by the average transactions per sales professional increasing to 2.65 for the first nine months of 2025, up from 2.29 in the same period in 2024, despite a 3.6% reduction in the number of sales professionals.
Smaller, specialized, or tech-enabled local brokerages can enter the private client segment more easily. This segment is Marcus & Millichap, Inc.'s core focus, consistently accounting for 80%+ of its brokerage revenue. Local entrants can target specific property types or sub-markets with lower initial overhead. However, to compete nationally, they must overcome the established market share Marcus & Millichap, Inc. holds in this segment, which generated $273.5 million in brokerage revenue for the first nine months of 2025.
Regulatory licensing requirements and the need for a national research platform present significant hurdles, though the latter is partially mitigated by third-party data providers. Brokerage firm licensing is state-by-state; for example, a Washington State original firm license fee is $304, while renewal fees vary widely, from $383 in Connecticut to no fee in Arizona. Building a proprietary national research platform is costly, but new entrants can subscribe to existing data services. For instance, some commercial real estate marketing platforms bundle proprietary data and demographics for monthly costs that can equate to around $66.25/month.
The existing 80+ office network and 1,640 professionals as of mid-2025 create a strong geographic defense for Marcus & Millichap, Inc.. This physical footprint supports local market knowledge, which is crucial for transaction execution. The firm's total revenue for Q3 2025 was $193.9 million.
Key structural elements that raise the barrier to entry for a direct, national competitor include:
- National footprint of more than 80 offices.
- Commission structure where 84% of Q3 2025 revenue came from brokerage.
- Variable state-level firm license fees, such as $304 in Washington for an original license.
- The need to match the 1,640 professionals active as of June 30, 2025.
- Proprietary research capabilities that support a national client base.
A table summarizing key operational metrics relevant to scale defense:
| Metric | Value (Latest Available) | Date/Period | Source Context |
|---|---|---|---|
| Total Professionals | 1,640 | As of June 30, 2025 | Investment sales and financing professionals |
| Office Network Size | More than 80 | As of Q2 2025 | Offices in US and Canada |
| Brokerage Revenue Share | 84% | Q3 2025 | Percentage of total revenue from brokerage commissions |
| Q3 2025 Brokerage Revenue | $162.2 million | Q3 2025 | Real estate brokerage commissions |
| Transactions per Professional (YTD) | 2.65 | First Nine Months of 2025 | Increase from 2.29 in the prior year period |
Disclaimer
All information, articles, and product details provided on this website are for general informational and educational purposes only. We do not claim any ownership over, nor do we intend to infringe upon, any trademarks, copyrights, logos, brand names, or other intellectual property mentioned or depicted on this site. Such intellectual property remains the property of its respective owners, and any references here are made solely for identification or informational purposes, without implying any affiliation, endorsement, or partnership.
We make no representations or warranties, express or implied, regarding the accuracy, completeness, or suitability of any content or products presented. Nothing on this website should be construed as legal, tax, investment, financial, medical, or other professional advice. In addition, no part of this site—including articles or product references—constitutes a solicitation, recommendation, endorsement, advertisement, or offer to buy or sell any securities, franchises, or other financial instruments, particularly in jurisdictions where such activity would be unlawful.
All content is of a general nature and may not address the specific circumstances of any individual or entity. It is not a substitute for professional advice or services. Any actions you take based on the information provided here are strictly at your own risk. You accept full responsibility for any decisions or outcomes arising from your use of this website and agree to release us from any liability in connection with your use of, or reliance upon, the content or products found herein.