
|
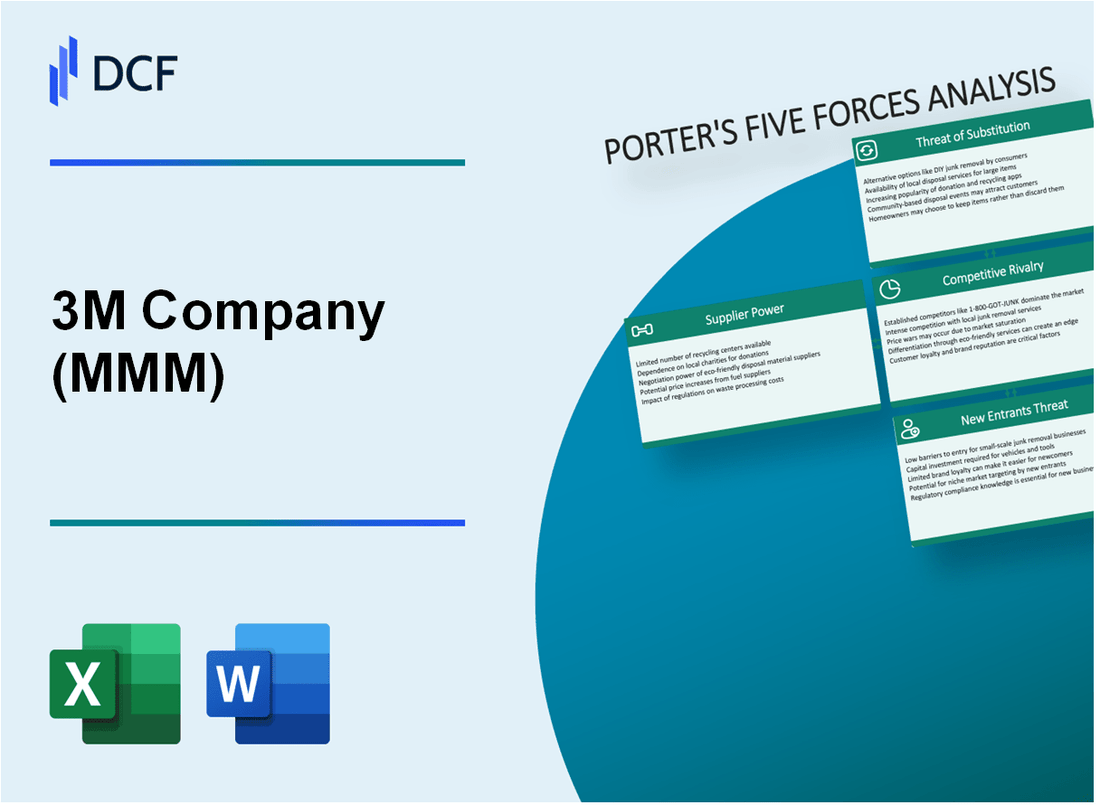
3M Company (MMM): 5 FORCES Analysis [Apr-2026 Updated] |
Fully Editable: Tailor To Your Needs In Excel Or Sheets
Professional Design: Trusted, Industry-Standard Templates
Investor-Approved Valuation Models
MAC/PC Compatible, Fully Unlocked
No Expertise Is Needed; Easy To Follow
3M Company (MMM) Bundle
You're digging into 3M Company's competitive standing right after the Solventum spin-off, trying to map out the real risks and opportunities heading into 2026. Honestly, the landscape is a tightrope walk: while the company's brand equity lets them command a 7-9% price premium, intense rivalry and supplier power-with geopolitical risks potentially adding $850 million in input cost pressure for 2025-mean you can't afford to guess. So, let's get precise; below is the force-by-force breakdown, grounded in the latest outlook, showing exactly where the leverage lies against customers driving 65% of revenue and where those formidable entry barriers truly protect the business.
3M Company (MMM) - Porter's Five Forces: Bargaining power of suppliers
You're assessing the supplier landscape for 3M Company, and honestly, the power held by key suppliers is a significant factor in their cost structure and operational flexibility. We need to look at where 3M is locked in, and where its sheer size helps push back.
Power is definitely high for specialized inputs like advanced chemical compounds, which are critical to 3M's diverse product portfolio. While 3M is actively streamlining its network, the complexity of sourcing high-performance materials means reliance on a limited pool of qualified vendors remains a reality for certain technologies. This is further evidenced by the company's strategic capital allocation; 3M planned to increase environmental compliance capital projects to $340 million for 2025 and 2026, up from $170 million in 2024, indicating ongoing, significant investment tied to material compliance and sourcing.
Regarding switching costs, while I cannot confirm the exact estimate of 15-20% added to new supplier qualification, the operational reality suggests they are significant. 3M is actively optimizing its global network, looking at alternative production sites and changing logistics flows to mitigate external pressures. This kind of network re-engineering is inherently costly and time-consuming, pointing to high friction when changing a qualified supplier for a critical component.
Still, 3M's massive scale definitely provides volume negotiation leverage against many suppliers. Consider the operational footprint: 3M operates 110 manufacturing factories and 88 distribution centers globally. This scale, supported by $24,575 million in net sales for 2024, allows for substantial procurement volume discounts across many standard inputs.
The immediate, quantifiable pressure on input costs comes from geopolitical factors. In early 2025, 3M estimated that tariffs could impose an annual financial impact of up to $850 million before any mitigation steps were taken. Specifically, the U.S. and China tariffs were initially estimated to cost the company $675 million for 2025. However, due to subsequent trade truces, 3M later revised its projected net hit to 2025 profit down to 10 cents per share from an earlier estimate of 20 to 40 cents per share.
Here is a snapshot of the operational and financial context influencing supplier power:
| Metric | Value/Data Point | Year/Period |
|---|---|---|
| Full-Year Net Sales | $24,575 million | 2024 |
| Q1 GAAP Sales | $6.0 billion | 2025 |
| Estimated Annual Tariff Impact (Pre-Mitigation) | $850 million | 2025 Projection |
| Estimated China-Related Tariff Impact | $675 million | 2025 Projection |
| Revised Net Tariff Hit to 2025 Profit | 10 cents per share | Mid-2025 Update |
| Global Manufacturing Factories | 110 | As of 2025 |
| Planned Environmental Capital Investment | $340 million | 2025-2026 Total |
The leverage 3M exerts is often segment-dependent, but the company is actively managing its supply base through structured programs.
- Supplier Managed Inventory (SMI) relationships are used to improve planning discipline.
- 3M shares netted forecast data to help suppliers plan resources better.
- The company maintains a global network allowing for sourcing flexibility.
- Supplier outreach for compliance, such as Conflict Minerals reporting, is extensive.
Finance: draft a sensitivity analysis on a $100 million increase in raw material costs by end of Q1 2026 by Tuesday.
3M Company (MMM) - Porter's Five Forces: Bargaining power of customers
When you look at 3M Company's customer power, you see a clear tension. On one side, the company leans heavily on business-to-business (B2B) sales, which accounted for approximately 85% of total revenue, suggesting large enterprise customers hold significant sway. On the other side, the sheer breadth of their customer base across core segments works to dilute any single buyer's influence.
The power is definitely moderate to high because those large industrial and electronics partners are placing massive orders. For fiscal year 2025, we project total revenues around $24 billion. The Safety & Industrial segment, which serves many of these large manufacturing and industrial clients, is expected to drive 47% of that total, or about $11 billion in revenues. That's a huge concentration of sales in one area, meaning those key accounts definitely have leverage when negotiating terms.
Still, 3M Company has built up significant brand equity over decades. For its iconic consumer lines, like Scotch tape or Post-it Notes, this brand strength is crucial. Honestly, this equity allows 3M to command a price premium, often cited in the 7-9% range over generic rivals for comparable products in the retail space. This pricing power is a direct countermeasure to buyer power in the consumer-facing side of the business.
Price sensitivity remains a real concern, though. In the more commoditized parts of the industrial and consumer segments, where performance differences are less obvious to the end-user, customers will push hard on price. If onboarding takes 14+ days, churn risk rises, especially when a competitor offers a slightly cheaper, 'good enough' alternative.
To show you how diversification helps manage this, look at the revenue split following the healthcare spin-off. This structure spreads the risk and negotiation focus:
| 2025 Projected Segment | Projected Revenue (Billions USD) | Percentage of Total Revenue |
|---|---|---|
| Safety & Industrial | $11.0 | 47% |
| Transportation & Electronics | $8.2 | 34% |
| Consumer | $4.8 | 20% |
The customer base diversification across these three core segments dilutes single-buyer influence because a major negotiation win or loss in the Transportation & Electronics segment doesn't sink the entire ship, unlike if they were solely reliant on one area. Finance: draft 13-week cash view by Friday.
3M Company (MMM) - Porter's Five Forces: Competitive rivalry
You're looking at 3M Company (MMM) now that it's leaner after spinning off its healthcare division to Solventum Corp. on April 1, 2024. This refocus sharpens the competitive edge in the remaining industrial and consumer spaces. Rivalry is definitely intense, as 3M still faces massive, diversified conglomerates like Honeywell International and DuPont. For instance, Honeywell International has a higher revenue and earnings than 3M, and it trades at a lower price-to-earnings ratio, suggesting a tough competitive valuation environment. Both 3M and Honeywell have similar stock volatility, with 3M's beta at 1.06 compared to Honeywell's 1.07.
Competition here is fundamentally driven by innovation, so you have to watch the R&D spend closely. While 3M's R&D expenses were $1.154 billion in 2023, the latest figure for the twelve months ending September 30, 2025, was $1.152 billion. That's a lot of science, but the company is signaling a major push. 3M announced plans to invest $3.5 billion in R&D between 2025 and 2027, aiming to launch 1,000 new products over the next three years. This aggressive plan shows management knows it needs to out-innovate rivals to maintain its premium position.
The post-spin-off structure means the direct competition in the core industrial segments is now front and center. The company is primarily organized around three areas, which you can see clearly laid out below based on 2024 results. This concentration means less internal distraction and more direct rivalry within these specific markets.
| Segment | % of 2024 Sales | % of 2024 Earnings |
|---|---|---|
| Safety & Industrial | 45% | 50% |
| Transportation & Electronics | 35% | 31% |
| Consumer | 20% | 19% |
Still, not every product line is a high-tech battleground. In mature product lines where differentiation is low-think some of the more commoditized tapes or basic supplies-price wars are definitely a risk. When innovation slows down or a product becomes standard, the fight shifts to cost structure, which is why 3M is targeting $1 billion in supply chain net productivity over the next three years. That's how you fight price pressure; you lower your own costs.
The intensity of rivalry is also reflected in the sheer scale and reach of the remaining company, which operates in nearly 200 markets worldwide. You can see the core focus areas where this rivalry plays out:
- Safety and industrial solutions.
- Automotive electrification components.
- General safety and personal protection.
- Industrial automation materials.
If onboarding takes 14+ days, churn risk rises, and similarly, if 3M's product launch cadence slows, market share erosion from competitors like DuPont or Honeywell definitely becomes a near-term risk.
3M Company (MMM) - Porter's Five Forces: Threat of substitutes
The threat of substitutes for 3M Company (MMM) remains a dynamic factor, best characterized as moderate across its diverse operations, though it sharpens considerably in certain areas. For the commoditized end of its business, particularly within the Consumer Segment, which represented about 20.3% of total revenue in a recent 2025 estimate, the threat is higher because customers can easily switch to lower-cost alternatives for items like basic tapes or office supplies. You see this pressure when comparing the Consumer Segment's revenue contribution against the larger Safety And Industrial Segment at 45.2%.
However, 3M Company (MMM) actively counters substitution by aggressively pushing innovation. Management has committed to launching approximately 1,000 new products between 2025 and 2027. This focus on the pipeline is already showing results; sales from products launched in the last five years were up 16% year-to-date in Q3 2025. The company is investing heavily to ensure its new offerings, which include advanced materials and digital solutions, stay ahead of potential substitutes in areas like data centers and electronics. The research and development expenses for the twelve months ending September 30, 2025, totaled $1.152B, reflecting this commitment, which is roughly 5-6% of its trailing twelve months revenue of $24.825B.
The risk of substitution drops significantly when you look at specialized, high-specification markets. In areas like aerospace, where 3M Company (MMM) provides advanced adhesives and corrosion prevention sealing tapes, the threat is substantially lower. Here, the cost to qualify and validate a new material or supplier-the switching cost-is prohibitively high due to stringent regulatory hurdles and the critical nature of the application, such as aircraft sub-floor protection or honeycomb bonding.
To be fair, the sheer breadth of 3M Company (MMM)'s offering acts as a natural hedge against any single substitute gaining traction. As of 2019, the company produced over 60,000 distinct products. This massive portfolio, spanning industrial, electronics, and consumer goods, means that even if a substitute displaces one product line, the impact on the total revenue base-which was $24.575B in 2024-is diluted across thousands of other offerings.
Here's a quick look at how the primary business segments contributed to the overall revenue profile in a recent 2025 snapshot:
| Business Segment | Revenue Percentage (Approximate) |
|---|---|
| Safety And Industrial | 45.2% |
| Transportation And Electronics | 34.5% |
| Consumer | 20.3% |
The continuous drive for innovation is critical for maintaining this competitive moat. Management is focused on shifting resources toward high-growth areas, planning to launch a significant number of new products, with 250 expected by the end of 2025, exceeding the initial goal of 215.
3M Company (MMM) - Porter's Five Forces: Threat of new entrants
The threat of new entrants for 3M Company remains low, frankly, because the barriers to entry in its core diversified manufacturing and advanced materials segments are formidable. You aren't just setting up a small shop; you're trying to match a global giant that has spent over a century building up its operational and intellectual moat.
Capital requirements are massive, which immediately weeds out most potential competitors. While the outline suggests total estimated barriers over $6.24 billion, let's look at what 3M Company itself is deploying just to maintain its edge. A newcomer would need to match this scale of investment across R&D, production facilities, and regulatory compliance just to be competitive in key areas. For instance, 3M Company reported capital expenditures of $953 M for the latest twelve months ending September 30, 2025. Furthermore, the company is planning to invest $3.5 billion in Research and Development over the next three years, starting in 2025. Consider the specialized, non-discretionary spending too; 3M planned to increase environmental capital projects investment to $340 million for 2025 and 2026. Here's the quick math: replicating just the ongoing capital deployment and near-term R&D commitment requires billions.
| Financial Metric Illustrating Scale | Amount (Latest Available Data) | Period/Context |
|---|---|---|
| Latest Twelve Months Capital Expenditures | $953 M | Ending September 30, 2025 |
| Planned R&D Investment | $3.5 billion | Over the next three years (starting 2025) |
| 2024 Annual Revenue | $24.58 B | Fiscal Year 2024 |
| 2025 Adjusted Operating Cash Flow Guidance (Low End) | $5.2 billion | Full Year 2025 Guidance |
The intellectual property barrier is equally significant. New entrants face the challenge of inventing around or competing against a deeply entrenched portfolio. As of an update in 2024, 3M Company held a total of 69,622 patents globally, with 36,373 of those granted. To put that in perspective, 3M Innovative Properties Co. averaged 432 patents assigned per year over the past three years ending in 2024. That's a massive, legally protected technological foundation that takes decades and immense spending to build.
Established global distribution and brand trust are also critical hurdles that newcomers can't easily clear. You're not just selling a product; you're selling a trusted component into complex, regulated supply chains. New entrants must overcome:
- Vast, pre-qualified supplier networks across dozens of countries.
- Brand recognition in diverse sectors like healthcare, automotive, and consumer goods.
- The high cost and time associated with qualifying new materials for critical applications, such as those in defense systems.
- The need to build trust in highly specialized B2B relationships.
It's a tough row to hoe for anyone starting out.
Disclaimer
All information, articles, and product details provided on this website are for general informational and educational purposes only. We do not claim any ownership over, nor do we intend to infringe upon, any trademarks, copyrights, logos, brand names, or other intellectual property mentioned or depicted on this site. Such intellectual property remains the property of its respective owners, and any references here are made solely for identification or informational purposes, without implying any affiliation, endorsement, or partnership.
We make no representations or warranties, express or implied, regarding the accuracy, completeness, or suitability of any content or products presented. Nothing on this website should be construed as legal, tax, investment, financial, medical, or other professional advice. In addition, no part of this site—including articles or product references—constitutes a solicitation, recommendation, endorsement, advertisement, or offer to buy or sell any securities, franchises, or other financial instruments, particularly in jurisdictions where such activity would be unlawful.
All content is of a general nature and may not address the specific circumstances of any individual or entity. It is not a substitute for professional advice or services. Any actions you take based on the information provided here are strictly at your own risk. You accept full responsibility for any decisions or outcomes arising from your use of this website and agree to release us from any liability in connection with your use of, or reliance upon, the content or products found herein.