
|
Moonpig Group PLC (MOON.L): BCG Matrix [Apr-2026 Updated] |
Fully Editable: Tailor To Your Needs In Excel Or Sheets
Professional Design: Trusted, Industry-Standard Templates
Investor-Approved Valuation Models
MAC/PC Compatible, Fully Unlocked
No Expertise Is Needed; Easy To Follow
Moonpig Group PLC (MOON.L) Bundle
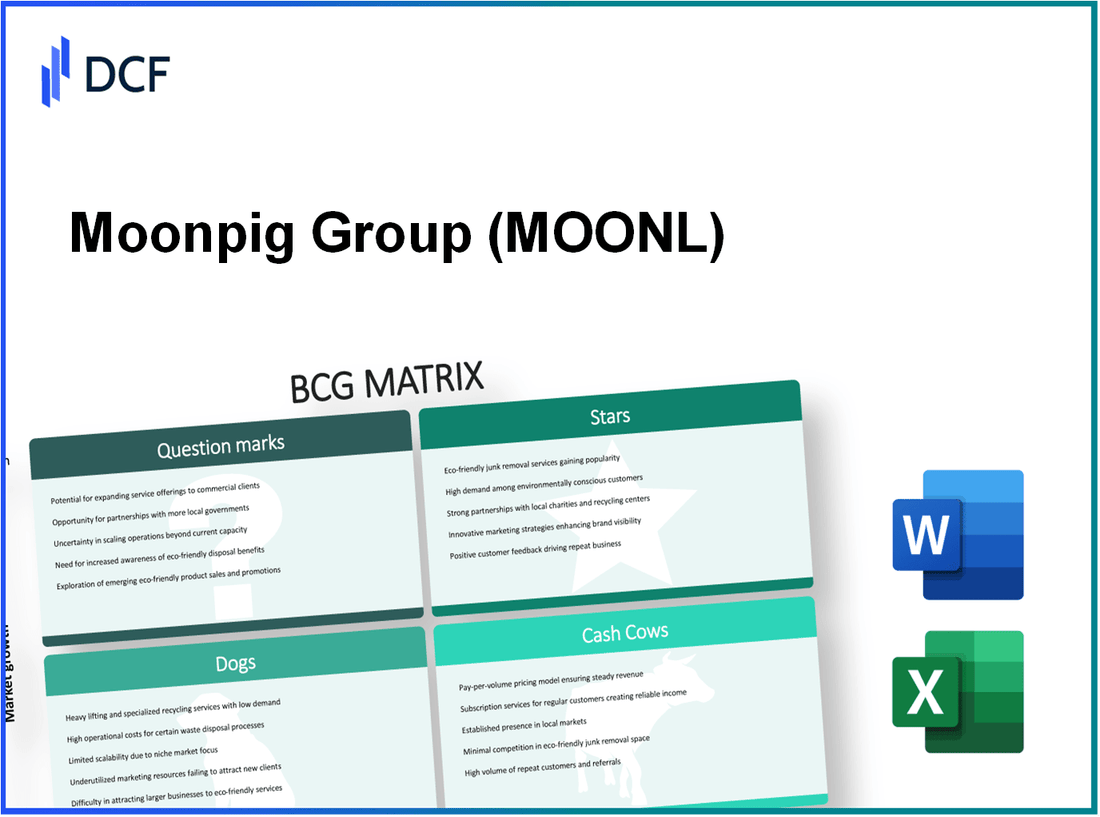
Moonpig's portfolio mixes a dominant, cash-generating UK cards business that funds high-growth bets - notably a booming app-led platform, Netherlands leadership, experiences and personalized gifting - while management must selectively pour CAPEX and marketing into international expansion, B2B and AI tools to turn question marks into stars and ruthlessly shrink low-margin legacy retail, desktop and pop-up dogs; how they balance reinvestment versus pruning will determine whether growth outpaces margin dilution or simply erodes the group's free cash flow advantage.
Moonpig Group PLC (MOON.L) - BCG Matrix Analysis: Stars
Stars - high-growth, high-market-share businesses within Moonpig's portfolio that demand investment to sustain rapid expansion and consolidate leadership. Key Stars: Greetz (Netherlands), Experiences (Red Letter Days & Buyagift), App-based commerce (Moonpig app and Moonpig Plus), and Personalized gifting & hampers (non-card physical gifts).
Greetz - Netherlands market expansion performance:
Greetz holds ~45% share of the Dutch online greeting card market as of late 2025, operating in a market growing >12% p.a. Revenue from the Netherlands represents 22% of group turnover. Underlying EBITDA margin for the Dutch operation is ~24%. CAPEX allocated to the segment equals 15% of segment revenue, focused on AI-driven personalization, localization, and EU payment/fulfillment compliance. Return on ad spend (ROAS) during peak periods averages 4.5x; customer retention in NL cohorts exceeds 48% year-over-year.
| Metric | Value |
|---|---|
| Market share (Netherlands) | 45% |
| Market growth (NL online greeting cards) | 12%+ p.a. |
| Revenue contribution (Group) | 22% |
| EBITDA margin (NL) | 24% |
| CAPEX (% of segment revenue) | 15% |
| Peak ROAS | 4.5x |
| Customer retention (cohorts) | 48% |
Experiences and Red Letter Days integration:
The combined experiences segment (Red Letter Days, Buyagift) accounts for 18% of group revenue, in a market expanding ~15% p.a. Operating margins have stabilized at ~20% due to a capital-light model relying on third-party suppliers and dynamic pricing. Moonpig has directed 10% of group CAPEX to platform integration for instant voucher delivery, bookings UX, and supplier APIs. Estimated UK gift experiences market size is £1.2bn, with Moonpig holding an acquisitive and cross-sell-led share that has increased materially post-integration.
| Metric | Value |
|---|---|
| Revenue contribution (Experiences) | 18% of group |
| Market growth (Experiences) | 15% p.a. |
| Operating margin (segment) | 20% |
| CAPEX allocation (group CAPEX) | 10% |
| UK experiences market size | £1.2 billion |
| Fulfillment model | Third-party partners (capital-light) |
- Cross-sell uplift: experiences attach rate to card/hampers customers improved by ~30%.
- Average order value (experiences) increased by ~18% YoY after bundling initiatives.
- Redemption elasticity: voucher instant-delivery reduced cancellation/refund rate by ~12%.
App-based revenue and digital engagement:
The Moonpig mobile app now drives ~75% of group orders. Active customers reached ~15 million by Dec 2025, a 20% YoY increase. App CAC is ~30% lower than web channels; app-driven conversion rates are ~2.8x higher. The Moonpig Plus subscription shows a 35% renewal/retention rate with a significant uplift in LTV for members (LTV up ~2.6x vs non-subscribers). Continuous investment in cloud infrastructure and data science represents a recurring CAPEX/OPEX need to maintain performance, personalization, and security at scale.
| Metric | Value |
|---|---|
| % Orders via app | 75% |
| Active customers (Dec 2025) | 15 million |
| Active customers YoY growth | 20% |
| App CAC vs web CAC | -30% |
| Moonpig Plus renewal rate | 35% |
| App conversion uplift vs web | ~2.8x |
- Monthly active user (MAU) engagement: average sessions per user +22% YoY.
- Subscription ARPU for Moonpig Plus members higher by ~140% vs non-members.
- Cloud/data CAPEX trend: +12% CAGR projected to 2027 to support personalization models.
Personalized gifting and hamper growth (excluding cards):
Personalized non-card gifting represents ~30% of total revenue, in a market growing ~10% p.a. Gross margins for personalized hampers and flowers are ~55% due to vertical integration and D2C fulfillment. Moonpig invested ~£15m in automated packing and fulfillment technology to scale throughput and reduce per-order handling costs by ~28%. UK online gift market share for personalized gifts is ~7%, compared to ~60% share in cards, indicating a sizable growth runway.
| Metric | Value |
|---|---|
| Revenue contribution (personalized gifts) | 30% of group |
| Market growth (personalized gifts) | 10% p.a. |
| Gross margin (hampers & flowers) | 55% |
| Investment in automation | £15 million |
| Fulfillment cost reduction post-automation | -28% |
| UK online market share (personalized gifts) | 7% |
| Cards market share (for comparison) | 60% |
- Average gross order value for hampers: +25% vs 2023 baseline.
- Repeat purchase rate for personalized gifts: ~42% within 12 months.
- Fulfillment SLA improvement: on-time delivery rate increased to 96% post-automation.
Moonpig Group PLC (MOON.L) - BCG Matrix Analysis: Cash Cows
Cash Cows
The UK online greeting card business is Moonpig's primary cash generator, commanding approximately 60% of the online card market. This mature segment contributes roughly 50% of total group revenue and operates in a low-growth environment with steady annual market expansion of 2%-3%. The segment delivers an industry-leading EBITDA margin of circa 35%, producing substantial free cash flow that funds the group's higher-growth initiatives and shareholder distributions.
| Metric | Value | Notes |
|---|---|---|
| Online market share (UK) | 60% | Share of UK online greeting card transactions |
| Contribution to group revenue | ~50% | Proportion of consolidated revenue from UK cards |
| Market growth rate | 2%-3% p.a. | Mature category growth |
| Segment EBITDA margin | 35% | Operational profitability of the unit |
| Segment CAPEX | ~3% of segment revenue | Primarily maintenance of printing facilities |
| Gross margin (group-wide impact) | >50% | Enhanced by vertical integration and printing efficiency |
| Annual free cash flow (approx.) | £80m | Generated by UK card operations and printing margin capture |
| Printing facility uptime | 98% | High-capacity, mature internal production |
The cash cow unit's economics are underpinned by a large, loyal customer base and efficient vertically integrated operations.
- Repeat customer database: 20 million historical customers.
- Repeat purchase rate: 70% of historical customers have bought again.
- Contribution margin for returning users: >40% due to minimal incremental marketing.
- Predictability: Revenue from repeat buyers provides stable, forecastable cash inflows.
Low incremental marketing and high repeat rates make revenues highly predictable; cash flows are regularly allocated to debt reduction and dividends, strengthening balance-sheet flexibility.
Moonpig's vertical integration includes in-house production in Guernsey and UK sites running at ~98% uptime. Primary investments in high-speed digital presses have been completed in prior cycles, so ongoing CAPEX is low relative to revenue. Control of the printing supply chain allows the company to capture full production margins and supports the group-wide gross margin above 50%.
- Unit cost advantage: Lower variable cost per card due to high throughput and automation.
- Low ongoing CAPEX: Major capital investments completed; ongoing spend focused on maintenance and small upgrades.
- Cash generation use: Approximately £80m annual free cash flow is available for strategic investment, deleveraging, and shareholder returns.
Key financial ratios and outcomes driven by the cash cow segment include a high operating cash conversion rate, sustained dividend capacity, and internal funding for new product and market expansion without reliance on equity issuance.
Moonpig Group PLC (MOON.L) - BCG Matrix Analysis: Question Marks
Dogs - Question Marks
International expansion beyond core markets: Moonpig is testing entry into multiple new European territories that collectively account for less than 5% of group revenue (~£15-25m annualized). These markets exhibit regional e‑commerce growth rates around 20% CAGR, but Moonpig's relative market share in each is below 2%, placing these operations firmly in the 'question mark' quadrant. Initial capital expenditure for localization (marketing, translation, payments, distribution hubs) has produced temporary negative operating margins in these territories: operating margin contribution estimated at -8% to -15% in year 1-2. Competitive intensity is high: established local incumbents and agile fintech/digital startups capture significant share. Key success factors include brand resonance parity with the UK/Netherlands, acquisition cost per active customer (CAC) below £20, and payback period under 24 months.
Corporate gifting and B2B solutions: The B2B corporate gifting platform targets an addressable UK corporate rewards market estimated at ~£2.0bn. Market growth for employee engagement and rewards solutions is approximately 18% annually. Moonpig's current revenue from this segment is under 3% of group revenue (~£10-20m run-rate). Entry requires substantial investment in a dedicated enterprise sales force (estimated incremental annual sales & marketing spend £5-8m) and bespoke integrations with HR/ERP systems (one‑time development CAPEX ~£1-3m). Current margins are compressed by high initial CAC (estimated £150-£350 per corporate client) and longer sales cycles (average 3-9 months). This unit is a classic question mark: with scale and retention (target net retention >110%), it could transition to a star; otherwise it may be divested.
AI‑powered creative design tools: Moonpig has deployed generative AI capabilities for card and gift personalization. The global market for AI‑assisted creative tools is growing >30% YoY. Presently, this channel contributes negligible direct revenue (<1% of group revenue) while consuming a disproportionate share of R&D resources: data science team costs are estimated at 12% of Moonpig's annual R&D budget (~£0.6-1.2m annually depending on budget baseline). User engagement metrics are strong (session time +25%, personalization usage on eligible flows ~40%), yet conversion lift to paid orders remains modest (estimated incremental conversion +1.0-1.8 percentage points). Total cost of ownership (development + infrastructure) is material; breakeven requires conversion uplift to at least +3-4 ppt or price premium capture of £1.50-£2.50 per order.
Comparative snapshot of the three question mark initiatives:
| Initiative | Current Revenue Contribution | Market Growth | Estimated Initial CAPEX/Investment | Short‑term Operating Margin | Key KPI for Star Conversion |
|---|---|---|---|---|---|
| International expansion (new EU territories) | ~<5% of group revenue (approx. £15-25m) | ~20% CAGR | £3-10m (local hubs, marketing) | -8% to -15% (year 1-2) | Market share >10% in target markets; CAC <£20; payback <24 months |
| Corporate gifting & B2B | <3% of group revenue (approx. £10-20m) | ~18% CAGR (employee engagement tools) | £6-12m (sales, integrations) | Low to negative due to high CAC; mid single‑digit margins at scale | Net retention >110%; CAC <£100 per long‑term client; payback <36 months |
| AI‑powered creative design | <1% of group revenue (negligible) | >30% YoY | Ongoing R&D: 12% of R&D budget (~£0.6-1.2m) + infra | Negative vs. infrastructure costs; marginal per‑order impact | Conversion uplift >+3 ppt or ability to charge premium £1.50-£2.50 per order |
Principal risks and evaluation criteria:
- Market share scaling risk: inability to move from <2% to meaningful share in new markets.
- High CAC and extended payback periods across initiatives.
- Incumbent and local competitor entrenchment raising go‑to‑market costs.
- R&D and technical overhead for AI may not translate to proportional incremental revenue.
- Operational complexity from managing multi‑channel, multi‑segment go‑to‑market strategies.
Quantitative thresholds management should monitor for each initiative include:
- Revenue run‑rate target within 24-36 months: international markets ≥£50m aggregate; B2B ≥£30-50m; AI features delivering ≥1% revenue uplift.
- Unit economics: CAC:LTV ratio >3 and CAC payback <24 months for consumer channels; for B2B CAC:LTV >4 expected with 36 month payback tolerance.
- Operating margin path: positive contribution by year 3 for international and B2B segments; AI ROI positive or modularized as a paid feature.
Moonpig Group PLC (MOON.L) - BCG Matrix Analysis: Dogs
Dogs - Traditional non-personalized retail products: The sales of non-personalized, third-party branded gift items have declined to under 4% of group revenue (latest fiscal: 3.8%). This category competes in a low-growth market (~0-1% CAGR) with intense price competition from major e-commerce aggregators, compressing gross margins to below 10% (estimated gross margin: 8.5%). Inventory turnover for these SKU lines is materially slower than the core personalized business: days inventory outstanding (DIO) for non-personalized items averages 120-150 days versus 30-45 days for personalized products, tying up working capital and increasing holding costs. CAPEX allocated to this category has been reduced to zero; current strategy is stock clearance via promotional activity, with markdowns reaching up to 35% in campaign periods. Lack of differentiation and low return on invested capital (ROIC estimated <3%) make this segment a clear candidate for further downsizing or exit.
Dogs - Legacy web platforms and desktop traffic: Desktop and legacy web platform sessions now account for under 15% of total sessions (14.2% latest period) and show negative growth of approximately -10% year-on-year, reflecting mobile-first migration. Conversion rates on legacy desktop are ~40% lower than the mobile app (desktop conv. ~1.2% vs app conv. ~2.0-2.5%), and revenue per session is similarly depressed. Maintenance and technical support costs for legacy systems represent a disproportionate share of platform OPEX (estimated 12-15% of platform support spend attributable to legacy codebases) despite delivering declining revenues. Management has an active initiative to migrate desktop users to the app and to sunset legacy systems, expecting to reduce ongoing maintenance costs by an estimated £2-4m annually after full decommissioning.
Dogs - Physical pop-up retail experiments: Small-scale physical pop-up stores have failed to capture meaningful market share, registering <1% share in the physical gift retail channel and contributing less than 0.5% of total group turnover (0.4% latest period). High short-term lease costs, staffing, and setup/teardown expenses have generated negative ROI for these units; average operating loss per pop-up location was approximately £20-30k over the pilot periods. The physical cards and gift retail market is flat to declining (0% to -1% CAGR), offering limited strategic upside. As a result, Moonpig is winding down pop-up activities and reallocating resources toward the higher-margin, scalable online ecosystem.
| Dog Segment | Revenue Share | Growth (YoY) | Gross Margin | Inventory DIO / Conversion | Cost/Impact Notes |
|---|---|---|---|---|---|
| Non-personalized retail products | 3.8% | ~0-1% (market) | ~8.5% | DIO 120-150 days | CAPEX = £0; markdowns up to 35%; ROIC <3% |
| Legacy web platforms (desktop) | 14.2% of sessions (revenue share lower) | -10% session growth YoY | Lower effective margin due to support costs | Desktop conv. ≈1.2% vs app 2.0-2.5% | Maintenance ~12-15% of platform support spend; potential £2-4m annual saving on decommission |
| Physical pop-up retail | 0.4% of turnover | Market 0% to -1% | Negative operating margins (losses per unit) | Market share <1% | Avg loss per pop-up ≈£20-30k; winding down operations |
Strategic implications and management actions:
- Prioritised de-investment: Continue reducing SKU range for non-personalized goods, accelerate stock clearance and supplier exit negotiations to free working capital.
- Platform rationalisation: Accelerate user migration from legacy desktop to the app, schedule phased decommissioning to realise £2-4m p.a. savings and reallocate engineering capacity to app features.
- Close or sell physical experiments: Wind down pop-ups, reassign retail personnel to fulfillment/marketing, and redeploy capex to digital growth initiatives with higher ROIC.
- Monitor KPIs weekly: Track DIO, desktop-to-app migration rate, markdown impact on gross margin, and per-unit loss on pop-ups to inform exit timing.
Disclaimer
All information, articles, and product details provided on this website are for general informational and educational purposes only. We do not claim any ownership over, nor do we intend to infringe upon, any trademarks, copyrights, logos, brand names, or other intellectual property mentioned or depicted on this site. Such intellectual property remains the property of its respective owners, and any references here are made solely for identification or informational purposes, without implying any affiliation, endorsement, or partnership.
We make no representations or warranties, express or implied, regarding the accuracy, completeness, or suitability of any content or products presented. Nothing on this website should be construed as legal, tax, investment, financial, medical, or other professional advice. In addition, no part of this site—including articles or product references—constitutes a solicitation, recommendation, endorsement, advertisement, or offer to buy or sell any securities, franchises, or other financial instruments, particularly in jurisdictions where such activity would be unlawful.
All content is of a general nature and may not address the specific circumstances of any individual or entity. It is not a substitute for professional advice or services. Any actions you take based on the information provided here are strictly at your own risk. You accept full responsibility for any decisions or outcomes arising from your use of this website and agree to release us from any liability in connection with your use of, or reliance upon, the content or products found herein.