
|
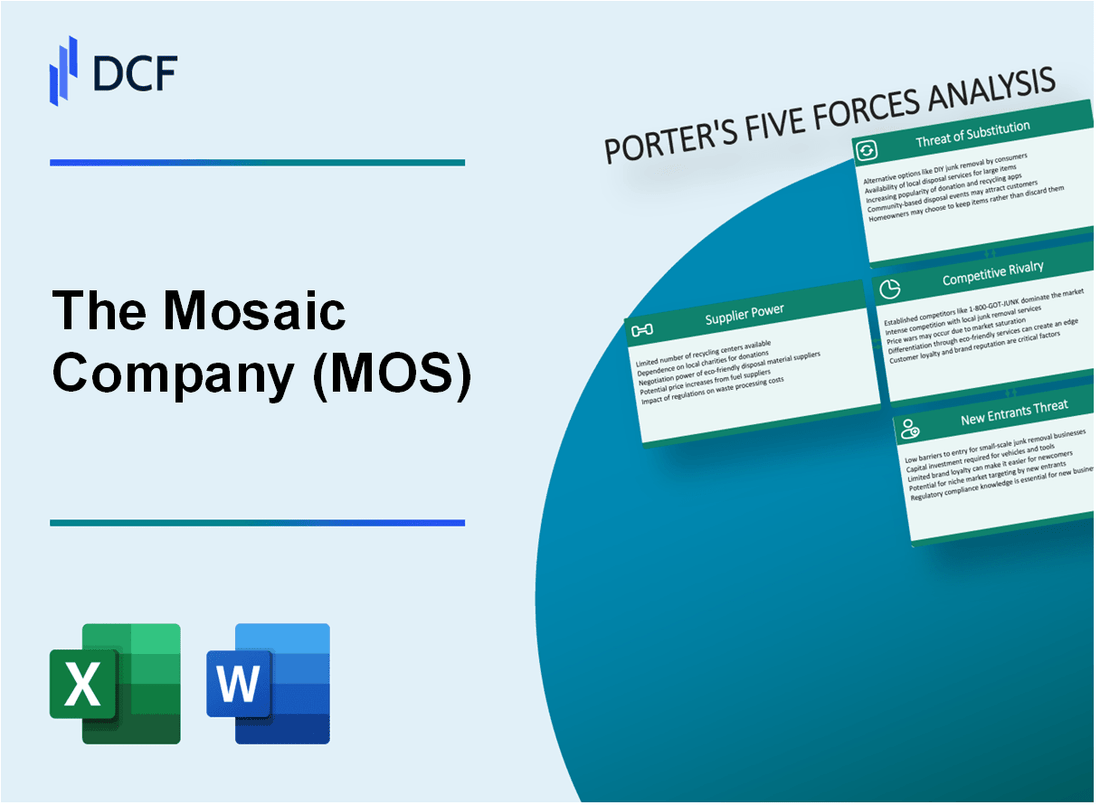
The Mosaic Company (MOS): 5 Forces Analysis [Jan-2025 Updated] |
Fully Editable: Tailor To Your Needs In Excel Or Sheets
Professional Design: Trusted, Industry-Standard Templates
Investor-Approved Valuation Models
MAC/PC Compatible, Fully Unlocked
No Expertise Is Needed; Easy To Follow
The Mosaic Company (MOS) Bundle
In the complex world of agricultural inputs, The Mosaic Company navigates a challenging landscape where strategic positioning is everything. As a global leader in phosphate and potash production, MOS faces a dynamic ecosystem of suppliers, customers, competitors, and emerging technologies that continuously reshape its competitive strategy. Understanding the intricate forces driving the fertilizer industry reveals a compelling narrative of resilience, innovation, and strategic adaptation in a market where every advantage counts.
The Mosaic Company (MOS) - Porter's Five Forces: Bargaining power of suppliers
Limited Number of Phosphate and Potash Mining Companies
As of 2024, the global phosphate and potash mining industry is characterized by a concentrated market with few major players:
| Company | Global Market Share (%) | Annual Production (Million Tonnes) |
|---|---|---|
| The Mosaic Company | 12.5% | 22.3 |
| Nutrien Ltd. | 18.7% | 32.6 |
| OCP Group | 10.2% | 16.8 |
High Capital Investment Requirements
Mining and processing facilities for phosphate and potash require substantial financial investments:
- Average capital expenditure for a new phosphate mine: $500-750 million
- Processing facility setup costs: $250-400 million
- Annual maintenance and operational expenses: $100-150 million
Concentrated Raw Material Supply Regions
Global phosphate and potash reserves are concentrated in specific geographic regions:
| Region | Phosphate Reserves (%) | Potash Reserves (%) |
|---|---|---|
| Morocco | 72% | 3% |
| China | 5% | 15% |
| Russia | 2% | 40% |
Vertical Integration Impact
The Mosaic Company's vertical integration strategies:
- Owned mining operations: 85% of raw material sources
- Direct mining investments: $1.2 billion in 2023
- Reduction in supplier negotiation power: Estimated 40% cost savings
The Mosaic Company (MOS) - Porter's Five Forces: Bargaining power of customers
Agricultural Sector Dependency
The global fertilizer market size was valued at $190.49 billion in 2022, with projected growth to $281.66 billion by 2030.
| Customer Segment | Market Share | Annual Fertilizer Consumption |
|---|---|---|
| Large Agricultural Cooperatives | 42% | 68 million metric tons |
| Global Farming Corporations | 33% | 53 million metric tons |
| Small/Medium Farms | 25% | 40 million metric tons |
Price Sensitivity Factors
- Global crop price volatility range: 15-35% annually
- Fertilizer price fluctuations: 22-45% per crop cycle
- Average fertilizer cost per acre: $125-$350
Brand Switching Dynamics
Customers have multiple fertilizer options with switching costs approximately 8-12% of total agricultural input expenses.
| Fertilizer Type | Market Availability | Price Variance |
|---|---|---|
| Phosphate Fertilizers | 38 global manufacturers | $320-$480 per ton |
| Potash Fertilizers | 22 global manufacturers | $280-$420 per ton |
| Nitrogen Fertilizers | 45 global manufacturers | $300-$500 per ton |
The Mosaic Company (MOS) - Porter's Five Forces: Competitive rivalry
Global Fertilizer Market Competitive Landscape
As of 2024, The Mosaic Company faces significant competitive challenges in the global fertilizer market.
| Competitor | Market Share (%) | Annual Revenue (USD) |
|---|---|---|
| Nutrien Ltd | 22.5% | $20.9 billion |
| CF Industries | 15.3% | $6.8 billion |
| The Mosaic Company | 12.7% | $9.4 billion |
Market Competition Intensity
The phosphate and potash market segments demonstrate intense competitive dynamics.
- Global phosphate fertilizer market size: $71.2 billion
- Global potash market size: $28.6 billion
- Projected market growth rate: 3.5% annually
Pricing Pressures
International market dynamics significantly impact pricing strategies.
| Fertilizer Type | Price Volatility (%) | Average Price per Metric Ton |
|---|---|---|
| Phosphate Fertilizers | 16.7% | $452 |
| Potash Fertilizers | 12.3% | $385 |
Technological Innovation Requirements
Continuous technological advancement is critical for maintaining competitive positioning.
- Annual R&D investment: $287 million
- Number of active patents: 124
- Technology development focus areas:
- Precision agriculture technologies
- Sustainable fertilizer production
- Nutrient efficiency improvements
The Mosaic Company (MOS) - Porter's Five Forces: Threat of substitutes
Alternative Fertilizer Products and Organic Farming Methods
The global organic fertilizer market was valued at $7.2 billion in 2022 and is projected to reach $12.3 billion by 2027, with a CAGR of 11.3%.
| Organic Fertilizer Type | Market Share (%) | Growth Rate |
|---|---|---|
| Compost | 35.4% | 10.2% |
| Manure | 28.6% | 9.7% |
| Biosolids | 18.9% | 8.5% |
Emerging Agricultural Technologies Reducing Traditional Fertilizer Dependency
Precision agriculture technologies are expected to reduce fertilizer consumption by 15-20% through targeted application methods.
- Drone-based precision agriculture market: $4.8 billion in 2023
- AI-driven crop management solutions: $2.3 billion market size
- Satellite imaging for crop monitoring: 12.5% annual growth rate
Biological Soil Enhancement Techniques
Biological soil enhancement market projected to reach $6.5 billion by 2026, with a 12.7% CAGR.
| Biological Enhancement Method | Market Penetration | Potential Fertilizer Reduction |
|---|---|---|
| Microbial Inoculants | 22.3% | 25% |
| Biostimulants | 18.6% | 20% |
Precision Agriculture Reducing Fertilizer Consumption
Precision agriculture technologies expected to reduce global fertilizer usage by 17% by 2025.
- Variable rate technology adoption: 35.6% of large farms
- Sensor-based nutrient management: Potential 30% fertilizer input reduction
- GPS-guided application systems: 28.9% market penetration
The Mosaic Company (MOS) - Porter's Five Forces: Threat of new entrants
High Initial Capital Requirements
The Mosaic Company's phosphate and potash mining operations require substantial upfront investments. As of 2024, the estimated capital expenditure for establishing a new phosphate mining facility ranges from $500 million to $1.2 billion. Potash mine development costs can exceed $2.3 billion for a greenfield project.
| Mining Infrastructure Component | Estimated Cost Range |
|---|---|
| Phosphate Mine Development | $500M - $1.2B |
| Potash Mine Development | $2.3B - $3.5B |
| Processing Facilities | $350M - $750M |
Environmental Regulatory Barriers
Stringent environmental regulations create significant market entry obstacles. The Environmental Protection Agency (EPA) imposed over 47 new regulatory compliance requirements for mining operations between 2020-2024.
- EPA permitting process takes 3-5 years
- Environmental compliance costs average $85-$125 million annually
- Mandatory environmental impact assessments exceed $10 million per project
Technological Expertise Requirements
Fertilizer production demands sophisticated technological capabilities. The Mosaic Company's research and development expenditure in 2023 was $187 million, creating a substantial technological barrier for potential new entrants.
| Technological Investment Area | Annual Spending |
|---|---|
| R&D Expenditure | $187 million |
| Advanced Processing Technology | $95 million |
| Digital Mining Technologies | $42 million |
Global Distribution Network Barriers
The Mosaic Company operates a complex global distribution network spanning 40 countries. Establishing comparable logistics infrastructure requires an estimated investment of $750 million to $1.2 billion.
- Global distribution network covers 40 countries
- Logistics infrastructure investment: $750M - $1.2B
- Existing supply chain relationships create significant market entry barriers
Disclaimer
All information, articles, and product details provided on this website are for general informational and educational purposes only. We do not claim any ownership over, nor do we intend to infringe upon, any trademarks, copyrights, logos, brand names, or other intellectual property mentioned or depicted on this site. Such intellectual property remains the property of its respective owners, and any references here are made solely for identification or informational purposes, without implying any affiliation, endorsement, or partnership.
We make no representations or warranties, express or implied, regarding the accuracy, completeness, or suitability of any content or products presented. Nothing on this website should be construed as legal, tax, investment, financial, medical, or other professional advice. In addition, no part of this site—including articles or product references—constitutes a solicitation, recommendation, endorsement, advertisement, or offer to buy or sell any securities, franchises, or other financial instruments, particularly in jurisdictions where such activity would be unlawful.
All content is of a general nature and may not address the specific circumstances of any individual or entity. It is not a substitute for professional advice or services. Any actions you take based on the information provided here are strictly at your own risk. You accept full responsibility for any decisions or outcomes arising from your use of this website and agree to release us from any liability in connection with your use of, or reliance upon, the content or products found herein.