
|
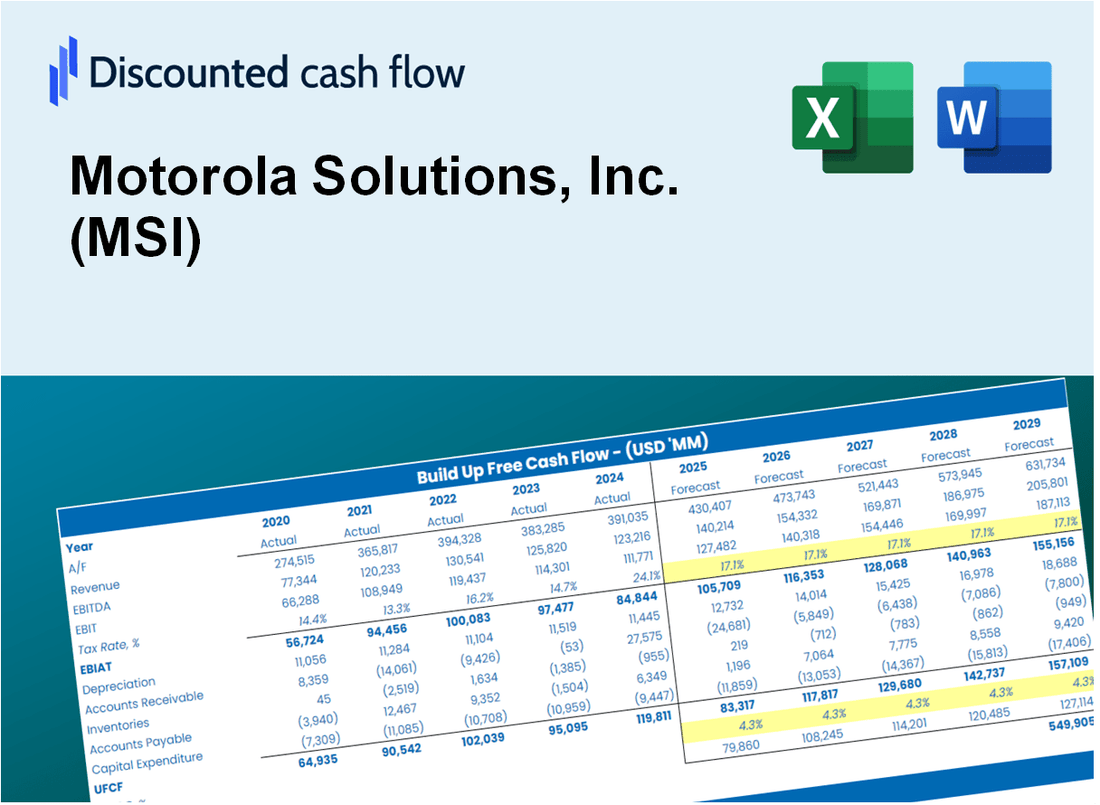
Motorola Solutions, Inc. (MSI) DCF Valuation |
Fully Editable: Tailor To Your Needs In Excel Or Sheets
Professional Design: Trusted, Industry-Standard Templates
Investor-Approved Valuation Models
MAC/PC Compatible, Fully Unlocked
No Expertise Is Needed; Easy To Follow
Motorola Solutions, Inc. (MSI) Bundle
Designed for accuracy, our Motorola Solutions, Inc. (MSI) DCF Calculator enables you to evaluate the valuation of Motorola Solutions, Inc. (MSI) using real-world financial data and offers complete flexibility to modify all essential parameters for enhanced projections.
What You Will Get
- Real MSI Financial Data: Pre-filled with Motorola Solutions' historical and projected data for precise analysis.
- Fully Editable Template: Easily modify key inputs such as revenue growth, WACC, and EBITDA %.
- Automatic Calculations: Observe Motorola Solutions' intrinsic value update instantly based on your adjustments.
- Professional Valuation Tool: Crafted for investors, analysts, and consultants aiming for accurate DCF results.
- User-Friendly Design: Intuitive structure and straightforward instructions suitable for all experience levels.
Key Features
- Comprehensive Financial Data: Gain access to reliable pre-loaded historical data and future forecasts for Motorola Solutions, Inc. (MSI).
- Adjustable Forecast Parameters: Modify the highlighted fields such as WACC, growth rates, and profit margins to suit your analysis.
- Real-Time Calculations: Enjoy automatic updates to DCF, Net Present Value (NPV), and cash flow assessments.
- User-Friendly Dashboard: Intuitive charts and summaries that make it easy to interpret your valuation findings.
- Designed for All Skill Levels: A straightforward, user-friendly layout tailored for investors, CFOs, and consultants alike.
How It Works
- Step 1: Download the prebuilt Excel template containing Motorola Solutions, Inc. (MSI) data.
- Step 2: Navigate through the pre-filled sheets to familiarize yourself with the essential metrics.
- Step 3: Modify forecasts and assumptions in the editable yellow cells (WACC, growth, margins).
- Step 4: Instantly observe updated results, including Motorola Solutions, Inc.'s (MSI) intrinsic value.
- Step 5: Make informed investment choices or generate reports based on the outputs.
Why Choose This Calculator?
- Accuracy: Real Motorola Solutions financials ensure data accuracy.
- Flexibility: Designed for users to test and modify inputs freely.
- Time-Saving: Skip the hassle of building a DCF model from scratch.
- Professional-Grade: Developed with CFO-level precision and usability in mind.
- User-Friendly: Easy to use, even for those without advanced financial modeling experience.
Who Should Use This Product?
- Individual Investors: Make informed decisions about buying or selling Motorola Solutions, Inc. (MSI) stock.
- Financial Analysts: Streamline valuation processes with ready-to-use financial models for Motorola Solutions, Inc. (MSI).
- Consultants: Deliver professional valuation insights on Motorola Solutions, Inc. (MSI) to clients quickly and accurately.
- Business Owners: Understand how technology leaders like Motorola Solutions, Inc. (MSI) are valued to guide your own strategy.
- Finance Students: Learn valuation techniques using real-world data and scenarios related to Motorola Solutions, Inc. (MSI).
What the Template Contains
- Pre-Filled Data: Includes Motorola Solutions’ historical financials and forecasts.
- Discounted Cash Flow Model: Editable DCF valuation model with automatic calculations.
- Weighted Average Cost of Capital (WACC): A dedicated sheet for calculating WACC based on custom inputs.
- Key Financial Ratios: Analyze Motorola Solutions’ profitability, efficiency, and leverage.
- Customizable Inputs: Edit revenue growth, margins, and tax rates with ease.
- Clear Dashboard: Charts and tables summarizing key valuation results.
Disclaimer
All information, articles, and product details provided on this website are for general informational and educational purposes only. We do not claim any ownership over, nor do we intend to infringe upon, any trademarks, copyrights, logos, brand names, or other intellectual property mentioned or depicted on this site. Such intellectual property remains the property of its respective owners, and any references here are made solely for identification or informational purposes, without implying any affiliation, endorsement, or partnership.
We make no representations or warranties, express or implied, regarding the accuracy, completeness, or suitability of any content or products presented. Nothing on this website should be construed as legal, tax, investment, financial, medical, or other professional advice. In addition, no part of this site—including articles or product references—constitutes a solicitation, recommendation, endorsement, advertisement, or offer to buy or sell any securities, franchises, or other financial instruments, particularly in jurisdictions where such activity would be unlawful.
All content is of a general nature and may not address the specific circumstances of any individual or entity. It is not a substitute for professional advice or services. Any actions you take based on the information provided here are strictly at your own risk. You accept full responsibility for any decisions or outcomes arising from your use of this website and agree to release us from any liability in connection with your use of, or reliance upon, the content or products found herein.