
|
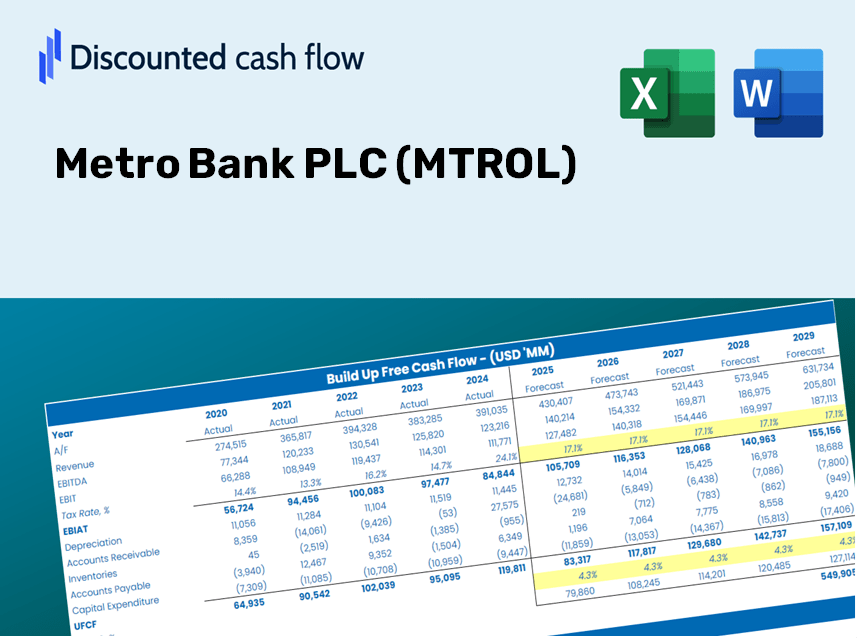
Metro Bank PLC (MTRO.L) DCF Valuation |
Fully Editable: Tailor To Your Needs In Excel Or Sheets
Professional Design: Trusted, Industry-Standard Templates
Investor-Approved Valuation Models
MAC/PC Compatible, Fully Unlocked
No Expertise Is Needed; Easy To Follow
Metro Bank PLC (MTRO.L) Bundle
Discover the true potential of Metro Bank PLC (MTROL) with our advanced DCF Calculator! Adjust key assumptions, explore various scenarios, and evaluate how changes affect Metro Bank PLC (MTROL) valuation – all within a single Excel template.
What You Will Receive
- Genuine Metro Bank Financials: Access to both historical and projected data for precise valuation.
- Customizable Inputs: Adjust WACC, tax rates, revenue growth, and capital expenditure assumptions.
- Real-Time Calculations: Intrinsic value and NPV are computed automatically.
- Scenario Analysis: Explore various scenarios to assess Metro Bank's future performance.
- User-Friendly and Professional Design: Crafted for experts while remaining straightforward for novices.
Key Features
- Authentic Metro Bank Financial Data: Gain access to precise pre-loaded historical figures and future forecasts.
- Adjustable Forecast Parameters: Tailor highlighted cells for WACC, growth rates, and margins to fit your analysis.
- Real-Time Calculations: Enjoy automatic updates for DCF, Net Present Value (NPV), and cash flow evaluations.
- Interactive Dashboard: Utilize user-friendly charts and summaries to visualize your valuation findings.
- Perfect for All Skill Levels: A straightforward, intuitive layout designed for investors, CFOs, and consultants alike.
How It Operates
- Step 1: Download the ready-made Excel template featuring data from Metro Bank PLC (MTROL).
- Step 2: Review the completed sheets and familiarize yourself with the essential metrics.
- Step 3: Adjust the forecasts and assumptions in the editable yellow cells (WACC, growth, margins).
- Step 4: Instantly see the updated results, including Metro Bank PLC's (MTROL) intrinsic value.
- Step 5: Utilize the outputs to make informed investment decisions or create detailed reports.
Why Opt for Metro Bank PLC's Calculator?
- Time-Saving: Skip the hassle of building a DCF model from the ground up – it's readily available for use.
- Enhanced Accuracy: Dependable financial information and formulas minimize valuation errors.
- Completely Customizable: Adjust the model to align with your specific assumptions and forecasts.
- User-Friendly: Intuitive charts and outputs facilitate easy analysis of results.
- Endorsed by Professionals: Crafted for experts who prioritize both precision and ease of use.
Who Should Use Metro Bank PLC (MTROL)?
- Professional Investors: Develop comprehensive and trustworthy valuation models for effective portfolio management.
- Corporate Finance Teams: Evaluate valuation scenarios to support strategic decisions within the organization.
- Consultants and Advisors: Equip clients with precise valuation analyses for Metro Bank PLC (MTROL) shares.
- Students and Educators: Utilize real-world data for financial modeling practice and instruction.
- Banking Enthusiasts: Explore the valuation methods applied to financial institutions like Metro Bank PLC (MTROL).
Contents of the Template
- Pre-Filled DCF Model: Metro Bank PLC’s financial data preloaded for immediate application.
- WACC Calculator: Comprehensive calculations for the Weighted Average Cost of Capital.
- Financial Ratios: Assess Metro Bank PLC's profitability, leverage, and operational efficiency.
- Editable Inputs: Modify assumptions like growth rates, profit margins, and capital expenditures to suit your specific scenarios.
- Financial Statements: Access annual and quarterly reports to aid in thorough analysis.
- Interactive Dashboard: Conveniently visualize key valuation metrics and outcomes.
Disclaimer
All information, articles, and product details provided on this website are for general informational and educational purposes only. We do not claim any ownership over, nor do we intend to infringe upon, any trademarks, copyrights, logos, brand names, or other intellectual property mentioned or depicted on this site. Such intellectual property remains the property of its respective owners, and any references here are made solely for identification or informational purposes, without implying any affiliation, endorsement, or partnership.
We make no representations or warranties, express or implied, regarding the accuracy, completeness, or suitability of any content or products presented. Nothing on this website should be construed as legal, tax, investment, financial, medical, or other professional advice. In addition, no part of this site—including articles or product references—constitutes a solicitation, recommendation, endorsement, advertisement, or offer to buy or sell any securities, franchises, or other financial instruments, particularly in jurisdictions where such activity would be unlawful.
All content is of a general nature and may not address the specific circumstances of any individual or entity. It is not a substitute for professional advice or services. Any actions you take based on the information provided here are strictly at your own risk. You accept full responsibility for any decisions or outcomes arising from your use of this website and agree to release us from any liability in connection with your use of, or reliance upon, the content or products found herein.