
|
Myers Industries, Inc. (MYE) DCF Valuation |
Fully Editable: Tailor To Your Needs In Excel Or Sheets
Professional Design: Trusted, Industry-Standard Templates
Investor-Approved Valuation Models
MAC/PC Compatible, Fully Unlocked
No Expertise Is Needed; Easy To Follow
Myers Industries, Inc. (MYE) Bundle
Explore the financial potential of Myers Industries, Inc. (MYE) with our user-friendly DCF Calculator! Enter your projections for growth, margins, and expenses to calculate the intrinsic value of Myers Industries, Inc. (MYE) and shape your investment strategy.
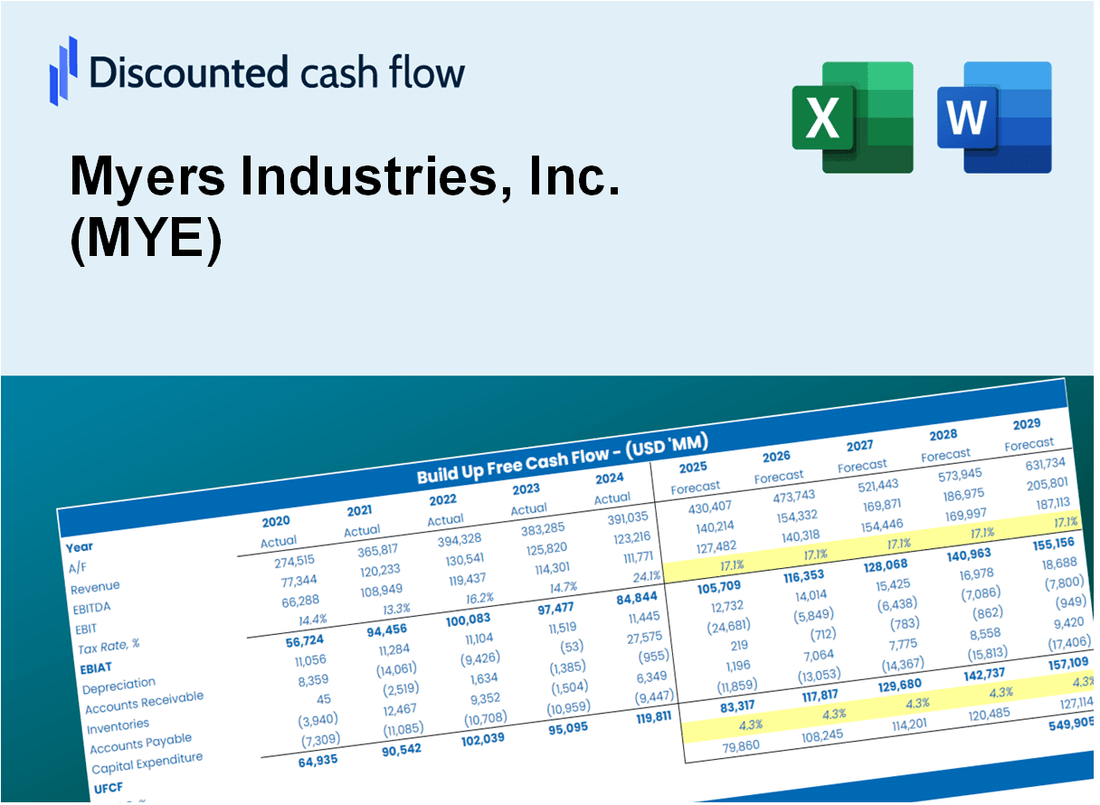
Discounted Cash Flow (DCF) - (USD MM)
| Year | AY1 2020 |
AY2 2021 |
AY3 2022 |
AY4 2023 |
AY5 2024 |
FY1 2025 |
FY2 2026 |
FY3 2027 |
FY4 2028 |
FY5 2029 |
|---|---|---|---|---|---|---|---|---|---|---|
| Revenue | 510.4 | 761.4 | 899.5 | 813.1 | 836.3 | 962.9 | 1,108.7 | 1,276.6 | 1,470.0 | 1,692.6 |
| Revenue Growth, % | 0 | 49.19 | 18.14 | -9.61 | 2.86 | 15.14 | 15.14 | 15.14 | 15.14 | 15.14 |
| EBITDA | 74.1 | 69.7 | 105.2 | 95.2 | 83.1 | 109.8 | 126.4 | 145.5 | 167.6 | 193.0 |
| EBITDA, % | 14.51 | 9.16 | 11.69 | 11.71 | 9.93 | 11.4 | 11.4 | 11.4 | 11.4 | 11.4 |
| Depreciation | 20.5 | 20.4 | 21.2 | 22.8 | 38.4 | 31.7 | 36.5 | 42.0 | 48.4 | 55.7 |
| Depreciation, % | 4.02 | 2.68 | 2.36 | 2.8 | 4.59 | 3.29 | 3.29 | 3.29 | 3.29 | 3.29 |
| EBIT | 53.6 | 49.3 | 83.9 | 72.4 | 44.7 | 78.1 | 89.9 | 103.5 | 119.2 | 137.3 |
| EBIT, % | 10.49 | 6.47 | 9.33 | 8.91 | 5.34 | 8.11 | 8.11 | 8.11 | 8.11 | 8.11 |
| Total Cash | 28.3 | 17.7 | 23.1 | 30.3 | 32.2 | 34.7 | 39.9 | 46.0 | 53.0 | 61.0 |
| Total Cash, percent | .0 | .0 | .0 | .0 | .0 | .0 | .0 | .0 | .0 | .0 |
| Account Receivables | 84.8 | 103.2 | 133.7 | 128.6 | 122.0 | 145.3 | 167.3 | 192.6 | 221.8 | 255.4 |
| Account Receivables, % | 16.61 | 13.55 | 14.86 | 15.82 | 14.59 | 15.09 | 15.09 | 15.09 | 15.09 | 15.09 |
| Inventories | 65.9 | 93.6 | 93.4 | 90.8 | 97.0 | 112.4 | 129.4 | 149.0 | 171.5 | 197.5 |
| Inventories, % | 12.92 | 12.29 | 10.38 | 11.17 | 11.6 | 11.67 | 11.67 | 11.67 | 11.67 | 11.67 |
| Accounts Payable | 61.2 | 81.7 | 73.5 | 79.1 | 71.0 | 94.6 | 108.9 | 125.4 | 144.4 | 166.2 |
| Accounts Payable, % | 11.98 | 10.73 | 8.17 | 9.72 | 8.5 | 9.82 | 9.82 | 9.82 | 9.82 | 9.82 |
| Capital Expenditure | -13.4 | -17.9 | -24.3 | -22.9 | -24.4 | -25.8 | -29.7 | -34.2 | -39.4 | -45.4 |
| Capital Expenditure, % | -2.63 | -2.35 | -2.7 | -2.81 | -2.92 | -2.68 | -2.68 | -2.68 | -2.68 | -2.68 |
| Tax Rate, % | 46.83 | 46.83 | 46.83 | 46.83 | 46.83 | 46.83 | 46.83 | 46.83 | 46.83 | 46.83 |
| EBITAT | 40.3 | 36.7 | 64.7 | 53.6 | 23.8 | 55.3 | 63.6 | 73.3 | 84.4 | 97.1 |
| Depreciation | ||||||||||
| Changes in Account Receivables | ||||||||||
| Changes in Inventories | ||||||||||
| Changes in Accounts Payable | ||||||||||
| Capital Expenditure | ||||||||||
| UFCF | -42.1 | 13.7 | 23.1 | 66.6 | 30.2 | 46.0 | 45.7 | 52.6 | 60.6 | 69.7 |
| WACC, % | 7.8 | 7.78 | 7.86 | 7.77 | 7.16 | 7.67 | 7.67 | 7.67 | 7.67 | 7.67 |
| PV UFCF | ||||||||||
| SUM PV UFCF | 217.5 | |||||||||
| Long Term Growth Rate, % | 2.00 | |||||||||
| Free cash flow (T + 1) | 71 | |||||||||
| Terminal Value | 1,254 | |||||||||
| Present Terminal Value | 866 | |||||||||
| Enterprise Value | 1,084 | |||||||||
| Net Debt | 382 | |||||||||
| Equity Value | 702 | |||||||||
| Diluted Shares Outstanding, MM | 37 | |||||||||
| Equity Value Per Share | 18.77 |
What You Will Get
- Real MYE Financials: Access to historical and projected data for precise valuation.
- Customizable Inputs: Adjust WACC, tax rates, revenue growth, and capital expenditures as needed.
- Dynamic Calculations: Intrinsic value and NPV are computed in real-time.
- Scenario Analysis: Explore various scenarios to assess Myers Industries' future performance.
- User-Friendly Design: Designed for professionals while remaining approachable for newcomers.
Key Features
- Comprehensive Financial Data: Access Myers Industries' historical financial statements and pre-filled projections.
- Customizable Parameters: Modify WACC, tax rates, revenue growth, and EBITDA margins to suit your analysis.
- Real-Time Analysis: Observe the intrinsic value of Myers Industries, Inc. (MYE) update instantly.
- Intuitive Visual Displays: Dashboard charts illustrate valuation outcomes and essential metrics clearly.
- Designed for Precision: A robust tool tailored for analysts, investors, and finance professionals.
How It Works
- Download the Template: Gain immediate access to the Excel-based MYE DCF Calculator.
- Input Your Assumptions: Modify the yellow-highlighted cells for growth rates, WACC, margins, and other variables.
- Instant Calculations: The model automatically recalculates Myers Industries’ intrinsic value.
- Test Scenarios: Experiment with different assumptions to assess possible valuation shifts.
- Analyze and Decide: Utilize the findings to inform your investment or financial strategy.
Why Choose This Calculator for Myers Industries, Inc. (MYE)?
- Accurate Data: Real Myers Industries financials guarantee dependable valuation results.
- Customizable: Tailor essential parameters such as growth rates, WACC, and tax rates to align with your forecasts.
- Time-Saving: Pre-configured calculations save you from starting from the ground up.
- Professional-Grade Tool: Crafted for investors, analysts, and consultants in the field.
- User-Friendly: Easy-to-navigate layout and step-by-step guidance ensure accessibility for all users.
Who Should Use This Product?
- Finance Students: Explore financial modeling techniques and apply them to real-world scenarios involving Myers Industries, Inc. (MYE).
- Academics: Integrate advanced valuation models into your research or teaching focused on Myers Industries, Inc. (MYE).
- Investors: Evaluate your investment strategies and analyze the valuation metrics of Myers Industries, Inc. (MYE).
- Analysts: Enhance your analysis process with a ready-to-use, customizable DCF model tailored for Myers Industries, Inc. (MYE).
- Small Business Owners: Understand the analytical frameworks used to assess companies like Myers Industries, Inc. (MYE).
What the Template Contains
- Comprehensive DCF Model: Editable template featuring detailed valuation calculations tailored for Myers Industries, Inc. (MYE).
- Real-World Data: Historical and projected financials for Myers Industries, Inc. (MYE) preloaded for in-depth analysis.
- Customizable Parameters: Modify WACC, growth rates, and tax assumptions to explore different scenarios.
- Financial Statements: Complete annual and quarterly breakdowns for enhanced insights into Myers Industries, Inc. (MYE).
- Key Ratios: Integrated analysis for evaluating profitability, efficiency, and leverage metrics.
- Dashboard with Visual Outputs: Interactive charts and tables providing clear, actionable results.
Disclaimer
All information, articles, and product details provided on this website are for general informational and educational purposes only. We do not claim any ownership over, nor do we intend to infringe upon, any trademarks, copyrights, logos, brand names, or other intellectual property mentioned or depicted on this site. Such intellectual property remains the property of its respective owners, and any references here are made solely for identification or informational purposes, without implying any affiliation, endorsement, or partnership.
We make no representations or warranties, express or implied, regarding the accuracy, completeness, or suitability of any content or products presented. Nothing on this website should be construed as legal, tax, investment, financial, medical, or other professional advice. In addition, no part of this site—including articles or product references—constitutes a solicitation, recommendation, endorsement, advertisement, or offer to buy or sell any securities, franchises, or other financial instruments, particularly in jurisdictions where such activity would be unlawful.
All content is of a general nature and may not address the specific circumstances of any individual or entity. It is not a substitute for professional advice or services. Any actions you take based on the information provided here are strictly at your own risk. You accept full responsibility for any decisions or outcomes arising from your use of this website and agree to release us from any liability in connection with your use of, or reliance upon, the content or products found herein.