
|
NovaBay Pharmaceuticals, Inc. (NBY) DCF Valuation |
Fully Editable: Tailor To Your Needs In Excel Or Sheets
Professional Design: Trusted, Industry-Standard Templates
Investor-Approved Valuation Models
MAC/PC Compatible, Fully Unlocked
No Expertise Is Needed; Easy To Follow
NovaBay Pharmaceuticals, Inc. (NBY) Bundle
Looking to determine the intrinsic value of NovaBay Pharmaceuticals, Inc.? Our (NBY) DCF Calculator integrates real-world data with extensive customization features, enabling you to refine your forecasts and enhance your investment strategies.
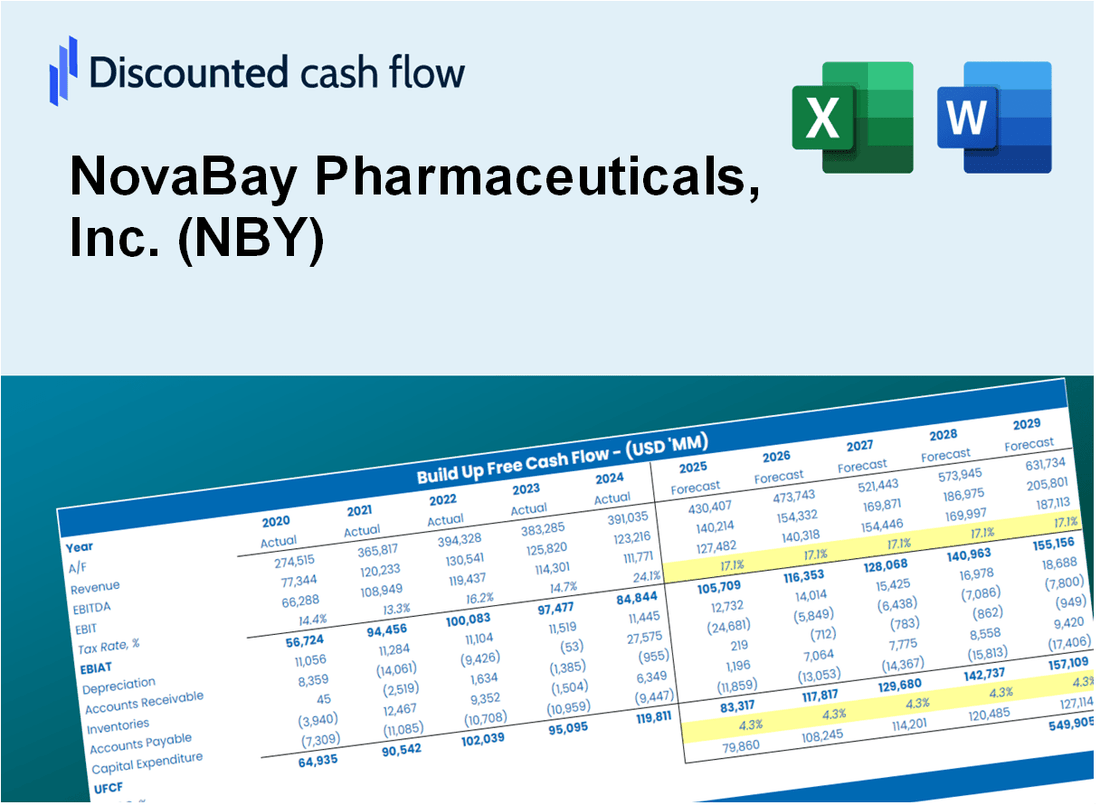
Discounted Cash Flow (DCF) - (USD MM)
| Year | AY1 2020 |
AY2 2021 |
AY3 2022 |
AY4 2023 |
AY5 2024 |
FY1 2025 |
FY2 2026 |
FY3 2027 |
FY4 2028 |
FY5 2029 |
|---|---|---|---|---|---|---|---|---|---|---|
| Revenue | 9.9 | 10.2 | 14.4 | 10.5 | 9.8 | 10.0 | 10.3 | 10.5 | 10.8 | 11.1 |
| Revenue Growth, % | 0 | 2.72 | 41.16 | -27.42 | -6.45 | 2.5 | 2.5 | 2.5 | 2.5 | 2.5 |
| EBITDA | -6.4 | -8.7 | -7.2 | -4.1 | -5.9 | -6.0 | -6.2 | -6.3 | -6.5 | -6.6 |
| EBITDA, % | -64.17 | -85.68 | -49.97 | -39.17 | -60.58 | -59.91 | -59.91 | -59.91 | -59.91 | -59.91 |
| Depreciation | .1 | .1 | .5 | .4 | .4 | .2 | .3 | .3 | .3 | .3 |
| Depreciation, % | 0.51339 | 1.17 | 3.35 | 3.41 | 3.9 | 2.47 | 2.47 | 2.47 | 2.47 | 2.47 |
| EBIT | -6.4 | -8.9 | -7.7 | -4.5 | -6.3 | -6.3 | -6.4 | -6.6 | -6.7 | -6.9 |
| EBIT, % | -64.69 | -86.85 | -53.32 | -42.57 | -64.47 | -62.38 | -62.38 | -62.38 | -62.38 | -62.38 |
| Total Cash | 12.0 | 7.5 | 5.4 | 3.1 | .4 | 4.9 | 5.0 | 5.2 | 5.3 | 5.4 |
| Total Cash, percent | .0 | .0 | .0 | .0 | .0 | .0 | .0 | .0 | .0 | .0 |
| Account Receivables | 1.1 | 1.7 | 2.0 | .8 | .4 | 1.1 | 1.1 | 1.1 | 1.1 | 1.2 |
| Account Receivables, % | 11.13 | 16.52 | 14 | 7.26 | 3.98 | 10.58 | 10.58 | 10.58 | 10.58 | 10.58 |
| Inventories | .6 | 3.2 | 3.4 | 2.9 | .8 | 1.9 | 2.0 | 2.0 | 2.1 | 2.1 |
| Inventories, % | 6.12 | 31.56 | 23.86 | 27.52 | 7.82 | 19.38 | 19.38 | 19.38 | 19.38 | 19.38 |
| Accounts Payable | .3 | 1.0 | 1.1 | 1.1 | .6 | .8 | .8 | .8 | .8 | .8 |
| Accounts Payable, % | 3.04 | 10.24 | 7.5 | 10.81 | 6.37 | 7.59 | 7.59 | 7.59 | 7.59 | 7.59 |
| Capital Expenditure | .0 | -.1 | -.1 | .0 | .0 | .0 | .0 | .0 | .0 | .0 |
| Capital Expenditure, % | -0.26173 | -0.5096 | -0.77756 | -0.18173 | -0.06134342 | -0.35839 | -0.35839 | -0.35839 | -0.35839 | -0.35839 |
| Tax Rate, % | -0.18031 | -0.18031 | -0.18031 | -0.18031 | -0.18031 | -0.18031 | -0.18031 | -0.18031 | -0.18031 | -0.18031 |
| EBITAT | -6.4 | -8.9 | -7.7 | -7.0 | -6.3 | -6.3 | -6.4 | -6.6 | -6.7 | -6.9 |
| Depreciation | ||||||||||
| Changes in Account Receivables | ||||||||||
| Changes in Inventories | ||||||||||
| Changes in Accounts Payable | ||||||||||
| Capital Expenditure | ||||||||||
| UFCF | -7.8 | -11.2 | -7.8 | -4.8 | -4.0 | -7.8 | -6.3 | -6.4 | -6.6 | -6.7 |
| WACC, % | 21.55 | 21.55 | 21.55 | 21.55 | 21.55 | 21.55 | 21.55 | 21.55 | 21.55 | 21.55 |
| PV UFCF | ||||||||||
| SUM PV UFCF | -19.7 | |||||||||
| Long Term Growth Rate, % | 2.00 | |||||||||
| Free cash flow (T + 1) | -7 | |||||||||
| Terminal Value | -35 | |||||||||
| Present Terminal Value | -13 | |||||||||
| Enterprise Value | -33 | |||||||||
| Net Debt | 1 | |||||||||
| Equity Value | -34 | |||||||||
| Diluted Shares Outstanding, MM | 3 | |||||||||
| Equity Value Per Share | -10.07 |
What You Will Get
- Pre-Filled Financial Model: NovaBay Pharmaceuticals' actual data enables precise DCF valuation.
- Full Forecast Control: Adjust revenue growth, margins, WACC, and other key drivers specific to (NBY).
- Instant Calculations: Automatic updates ensure you see results as you make changes for (NBY).
- Investor-Ready Template: A refined Excel file designed for professional-grade valuation of (NBY).
- Customizable and Reusable: Tailored for flexibility, allowing repeated use for detailed forecasts related to (NBY).
Key Features
- 🔍 Real-Life NBY Financials: Pre-filled historical and projected data for NovaBay Pharmaceuticals, Inc. (NBY).
- ✏️ Fully Customizable Inputs: Adjust all critical parameters (yellow cells) like WACC, growth %, and tax rates.
- 📊 Professional DCF Valuation: Built-in formulas calculate NovaBay’s intrinsic value using the Discounted Cash Flow method.
- ⚡ Instant Results: Visualize NovaBay’s valuation instantly after making changes.
- Scenario Analysis: Test and compare outcomes for various financial assumptions side-by-side.
How It Works
- Download: Obtain the pre-formulated Excel file containing NovaBay Pharmaceuticals' (NBY) financial data.
- Customize: Modify projections, including revenue growth, EBITDA %, and WACC as needed.
- Update Automatically: The intrinsic value and NPV calculations refresh in real-time.
- Test Scenarios: Generate various projections and instantly compare the results.
- Make Decisions: Leverage the valuation findings to inform your investment approach.
Why Choose NovaBay Pharmaceuticals, Inc. (NBY)?
- Innovative Solutions: Cutting-edge products designed to meet modern healthcare challenges.
- Proven Efficacy: Clinical studies demonstrate the effectiveness of our pharmaceutical offerings.
- Commitment to Quality: Rigorous quality control processes ensure the highest standards in our products.
- Patient-Centric Approach: We prioritize patient needs and outcomes in our research and development.
- Backed by Expertise: Our team comprises industry veterans dedicated to advancing healthcare.
Who Should Use NovaBay Pharmaceuticals, Inc. (NBY)?
- Healthcare Investors: Make informed decisions with a reliable analysis of pharmaceutical valuations.
- Market Analysts: Streamline your research with comprehensive data and insights tailored for the biotech sector.
- Consultants: Effortlessly modify reports and presentations to showcase NovaBay's market position and potential.
- Biotech Enthusiasts: Enhance your knowledge of the pharmaceutical industry through detailed case studies and examples.
- Educators and Students: Utilize it as a valuable resource for learning about pharmaceutical economics and valuation methodologies.
What the Template Contains
- Operating and Balance Sheet Data: Pre-filled NovaBay Pharmaceuticals (NBY) historical data and forecasts, including revenue, EBITDA, EBIT, and capital expenditures.
- WACC Calculation: A dedicated sheet for Weighted Average Cost of Capital (WACC), including parameters like Beta, risk-free rate, and share price.
- DCF Valuation (Unlevered and Levered): Editable Discounted Cash Flow models showing intrinsic value with detailed calculations.
- Financial Statements: Pre-loaded financial statements (annual and quarterly) to support analysis.
- Key Ratios: Includes profitability, leverage, and efficiency ratios for NovaBay Pharmaceuticals (NBY).
- Dashboard and Charts: Visual summary of valuation outputs and assumptions to analyze results easily.
Disclaimer
All information, articles, and product details provided on this website are for general informational and educational purposes only. We do not claim any ownership over, nor do we intend to infringe upon, any trademarks, copyrights, logos, brand names, or other intellectual property mentioned or depicted on this site. Such intellectual property remains the property of its respective owners, and any references here are made solely for identification or informational purposes, without implying any affiliation, endorsement, or partnership.
We make no representations or warranties, express or implied, regarding the accuracy, completeness, or suitability of any content or products presented. Nothing on this website should be construed as legal, tax, investment, financial, medical, or other professional advice. In addition, no part of this site—including articles or product references—constitutes a solicitation, recommendation, endorsement, advertisement, or offer to buy or sell any securities, franchises, or other financial instruments, particularly in jurisdictions where such activity would be unlawful.
All content is of a general nature and may not address the specific circumstances of any individual or entity. It is not a substitute for professional advice or services. Any actions you take based on the information provided here are strictly at your own risk. You accept full responsibility for any decisions or outcomes arising from your use of this website and agree to release us from any liability in connection with your use of, or reliance upon, the content or products found herein.