
|
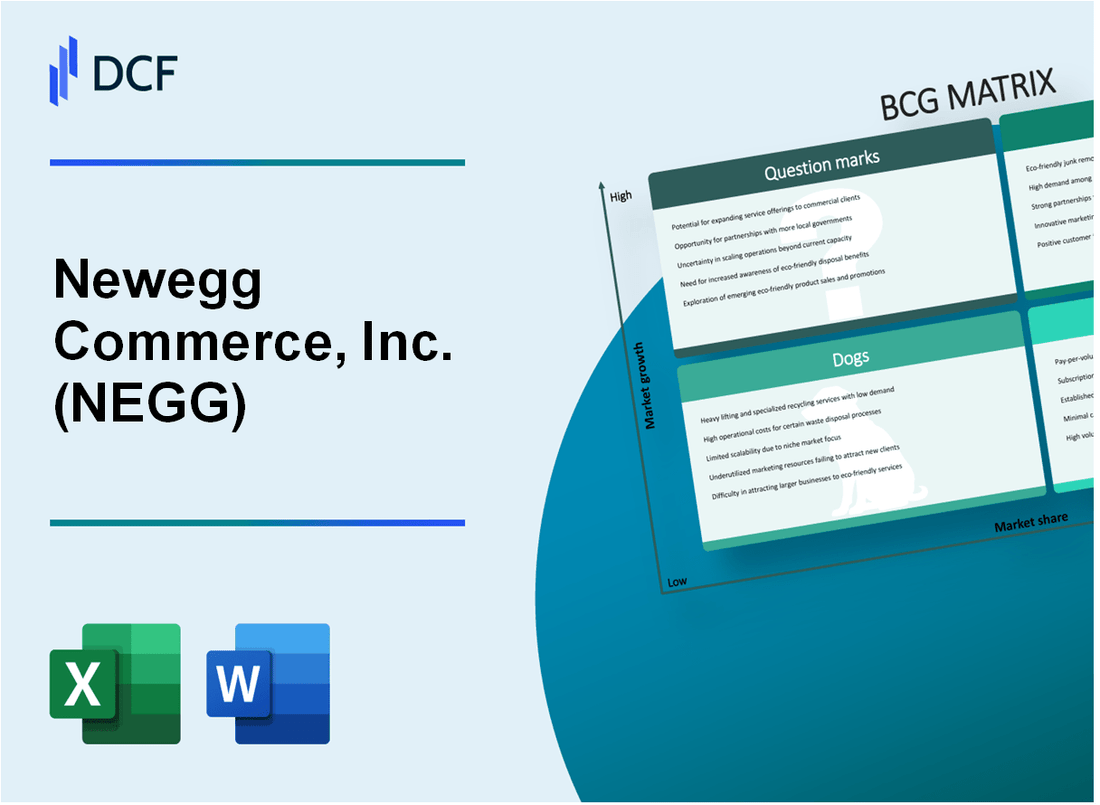
Newegg Commerce, Inc. (NEGG): BCG Matrix [Dec-2025 Updated] |
Fully Editable: Tailor To Your Needs In Excel Or Sheets
Professional Design: Trusted, Industry-Standard Templates
Investor-Approved Valuation Models
MAC/PC Compatible, Fully Unlocked
No Expertise Is Needed; Easy To Follow
Newegg Commerce, Inc. (NEGG) Bundle
You're looking at the engine room of Newegg Commerce, Inc. right now, and the picture is complex: while core PC components are driving 12.6% net sales growth and the established marketplace is churning out $849.1 million in Gross Merchandise Volume (GMV), we have to face the legacy tech dragging down results, contributing to that $4.2 million H1 2025 net loss. As a seasoned analyst, I've mapped their entire portfolio-from the high-growth Stars like the new GPU series to the capital-intensive Question Marks like enterprise AI hardware-to show you exactly where to place your bets for the rest of 2025 and beyond.
Background of Newegg Commerce, Inc. (NEGG)
You're looking at Newegg Commerce, Inc. (NEGG), which stands as a key global online retailer focused on technology, specifically PC hardware, consumer electronics, and gaming gear. Based in Diamond Bar, California, Newegg Commerce serves both individual customers and businesses through its comprehensive e-commerce platform. The company's performance in 2025 has been a story of top-line growth coupled with a significant push toward operational efficiency, which you can see clearly in the first half results.
For the six months ending June 30, 2025, Newegg Commerce reported net sales of $695.7 million, marking a solid 12.6% year-over-year increase from the $618.1 million seen in the first half of 2024. This growth was heavily fueled by the successful launch cycles for new high-performance components, like the NVIDIA GeForce RTX 50 Series and AMD Radeon RX 9000 Series graphics cards, plus the AMD Ryzen 9000X3D Series CPUs. This demand boosted the Gross Merchandise Volume (GMV) by 13.7% to $849.1 million over the same period.
Honestly, the real story in H1 2025 is the margin improvement. Gross profit jumped 26.5% to $79.8 million, and the company managed to turn an Adjusted EBITDA loss of $7.3 million in H1 2024 into a positive $11.3 million for the first half of 2025. This financial shift came alongside strategic cost optimization measures that reduced Selling, General, and Administrative (SG&A) expenses. Plus, the average order value climbed to $467, and the repeat purchase rate improved to 25.2%, showing better customer engagement.
Despite this operational progress, the company is still navigating the path to consistent net profitability. The net loss for the first half of 2025 narrowed substantially to $4.2 million from $25.0 million the year prior. Looking ahead, Newegg Commerce issued preliminary full-year 2025 guidance in October, projecting net sales between $1.38 billion and $1.42 billion. However, this guidance also anticipates a full-year net loss, estimated to be between $10.4 million and $15.8 million, though they project a positive Adjusted EBITDA in the range of $13.7 million to $19.1 million for the full year.
To support operations and working capital while managing macroeconomic factors and ongoing tariff environments, Newegg Commerce has been active in liquidity management. As of September 30, 2025, the company had 20,966,480 common shares outstanding. They also disclosed raising $37.4 million in gross proceeds through their 'at the market' (ATM) offering program, which helps maintain financial flexibility as they execute on growth initiatives like expanding their ABS line of high-performance PCs and launching new gamer community features.
Newegg Commerce, Inc. (NEGG) - BCG Matrix: Stars
Stars in the Boston Consulting Group Matrix represent business units or products operating in a high-growth market where Newegg Commerce, Inc. holds a high relative market share. These units are leaders in their space and require significant investment to maintain growth and market position, often resulting in cash flow that is reinvested back into the unit.
The core PC Components segment, particularly high-end graphics processing units (GPUs) and central processing units (CPUs), clearly fits the Star quadrant for Newegg Commerce, Inc. as of the first half of 2025. This category is characterized by strong market dynamics and direct contribution to the company's top-line performance.
The success in this area is directly tied to major product cycle refreshes. Specifically, the launch of the NVIDIA GeForce RTX 50 Series and AMD Radeon RX 9000 Series graphics cards, alongside the AMD Ryzen 9000X3D Series CPUs, acted as significant catalysts. These premium hardware sales are reflected in improved customer spending metrics.
Here's a look at the key performance indicators for the first half of 2025 that position this segment as a Star:
| Metric | Value (H1 2025) | Comparison/Context |
| Net Sales Growth (YoY) | 12.6% | Driven by Core PC Components |
| Net Sales Amount | $695.7 million | Up from $618.1 million in H1 2024 |
| Average Order Value (AOV) | $467 | Up from $401 in H1 2024 |
| Gross Merchandise Value (GMV) Growth (YoY) | 13.7% | Reflecting high-volume component sales |
| Adjusted EBITDA | $11.3 million | A substantial improvement from a $7.3 million loss in H1 2024 |
The high-end Gaming Hardware category is operating within a market environment that Newegg Commerce, Inc. is leveraging effectively. The growth rate of this segment aligns with the projected high-growth trajectory for the broader market. You can see the alignment in the market context:
- High-growth segment aligns with the projected 12-15% CAGR for global gaming/AI hardware through 2030.
- The broader Global Artificial Intelligence in Hardware Market is projected to exhibit a CAGR of 16.2% from 2025 to 2032.
- The Artificial Intelligence in Gaming Market is projected to expand at a CAGR of 22.7% from 2023 to 2030.
The increased AOV to $467 is a concrete indicator of the success in selling premium, high-value hardware, which is characteristic of a Star product line. This indicates that customers are purchasing higher-priced items, likely the new generation GPUs and CPUs, rather than just lower-margin accessories. The substantial growth in net sales by 12.6% confirms the high market growth, and the company's ability to generate $11.3 million in Adjusted EBITDA, reversing a prior loss, shows that Newegg Commerce, Inc. is successfully capturing market share in this demanding category. To keep these units as Stars, Newegg Commerce, Inc. must continue to invest heavily in promotion and placement to fend off competitors. If the market growth slows, these units are positioned to transition into Cash Cows.
Key operational metrics supporting the Star status include:
- Robust sales of PC components, particularly boosted by new GPU and CPU launches.
- Gross profit growth of 26.5% to $79.8 million for the six months ended June 30, 2025.
- Repeat purchase rate improved to 25.2% from 23.0% last year.
Newegg Commerce, Inc. (NEGG) - BCG Matrix: Cash Cows
You're looking at the core, established engine of Newegg Commerce, Inc. These are the business units that have achieved high market share in mature segments, reliably churning out cash to fund the rest of the portfolio. They don't need heavy marketing spend; they just need maintenance and efficiency improvements to maximize the cash yield.
The financial performance for the first half of 2025 clearly shows this segment's contribution to profitability, especially when you look at the turnaround in operating results. Strategic cost optimization measures implemented throughout 2024 and 2025 directly impacted the bottom line.
Here's a look at the key financial metrics from the first six months of 2025:
| Metric | H1 2025 Value | H1 2024 Value |
| Gross Merchandise Value (GMV) | $849.1 million | $746.7 million |
| Net Sales | $695.7 million | $618.1 million |
| Gross Profit | $79.8 million | $63.1 million |
| Adjusted EBITDA | $11.3 million | Negative $7.3 million |
| Net Loss | $4.2 million | $25.0 million |
The improvement in Adjusted EBITDA to $11.3 million from a negative $7.3 million in the prior year period is the direct result of milking these established operations efficiently. The full-year 2025 guidance, as of October 2025, projects this positive trend to continue, with an expected Adjusted EBITDA range of $13.7-$19.1 million for the twelve months ended December 31, 2025.
The established Third-Party Marketplace (3P) operations are a key component here, generating steady commission revenue off the total GMV. While the specific commission revenue isn't broken out, the total GMV provides the base for this high-margin stream. The platform supported a Gross Merchandise Value of $849.1 million in H1 2025.
Consider the core infrastructure supporting this volume. This includes the underlying e-commerce platform and logistics network, which must be maintained for operational stability. The platform supported an Average Order Value (AOV) of $467 for the first half of 2025, up from $401 in the prior year, and served approximately 1.13 million active customers as of June 30, 2025.
General PC Peripherals and Accessories represent the stable, mature market demand that defines a Cash Cow. While the H1 2025 growth was significantly boosted by new GPU and CPU launches, the consistent base of monitors, keyboards, and other accessories provides the reliable, lower-growth revenue stream. These units require minimal investment to maintain their high market share.
The focus for these units is on efficiency, not aggressive growth spending. The company has already taken action, as evidenced by the improved profitability. Further investments should target infrastructure support to increase cash flow, rather than product promotion:
- Maintain existing supplier relationships to keep component costs stable.
- Optimize warehouse utilization to lower per-unit fulfillment cost.
- Invest in platform stability to support the $849.1 million H1 2025 GMV base.
- Leverage liquidity raised, such as the $37.4 million gross proceeds from the ATM program as of September 30, 2025, for efficiency upgrades, not risky market expansion.
These units are the source of the cash that helps cover corporate overhead and fund riskier ventures. They are the business units that Newegg Commerce, Inc. strives to protect and 'milk' passively.
Newegg Commerce, Inc. (NEGG) - BCG Matrix: Dogs
Dogs, are units or products with a low market share and low growth rates. They frequently break even, neither earning nor consuming much cash. Dogs are generally considered cash traps because businesses have money tied up in them, even though they bring back almost nothing in return. These business units are prime candidates for divestiture.
For Newegg Commerce, Inc. (NEGG), the Dogs quadrant represents those business areas that are not benefiting from the strong demand seen in core PC components. These are the segments that drag on overall profitability, even when the high-growth areas show improvement. Dogs are in low growth markets and have low market share, and expensive turn-around plans usually do not help.
The financial impact of these lower-performing segments is visible when looking at the bottom line. Despite the strong performance in high-end hardware, Newegg Commerce, Inc. reported a net loss of $4.2 million for the six months ended June 30, 2025. This loss is attributed, in part, to the drag from these low-growth, low-share categories. Looking ahead, the preliminary guidance for the full twelve months ended December 31, 2025, projects a net loss in the range of $15.8 million to $10.4 million.
The characteristics of these Dog categories align with specific operational metrics that show erosion or stagnation:
- Commoditized, low-margin general consumer electronics (e.g., basic home video/audio).
- Older, legacy product inventory with slow turnover and minimal competitive advantage.
- Highly competitive, non-specialized product categories where Amazon or Best Buy dominate.
The overall customer base health reflects challenges that may stem from these weaker categories. As of December 31, 2024, the active customer base totaled approximately 2.1 million, a decrease from 2.5 million the prior year. Furthermore, the repeat purchase rate, a key indicator of customer satisfaction and loyalty, was 26.0% as of December 31, 2024, down from 29.2% the prior year. Even in Q2 2025 context, the repeat purchase rate fell 3.2 percentage points.
You're looking at areas where capital is tied up without generating sufficient return. Here's a quick look at the financial context where these Dogs operate:
| Metric | Value (H1 2025) | Comparison Point |
| Net Loss | $4.2 million | Improved from $25.0 million loss in H1 2024 |
| Adjusted EBITDA | $11.3 million | Up from negative $7.3 million loss in H1 2024 |
| Projected Full-Year 2025 Net Loss | $15.8 million to $10.4 million | Full-year guidance range |
| Active Customers (End of 2024) | 2.1 million | Down from 2.5 million the prior year |
These Dog segments should be avoided and minimized. The strategy here is typically divestiture or aggressive pruning, as expensive turn-around plans for low-growth, low-share businesses rarely pay off in the long run for Newegg Commerce, Inc. Finance: draft 13-week cash view by Friday.
Newegg Commerce, Inc. (NEGG) - BCG Matrix: Question Marks
You're looking at the parts of Newegg Commerce, Inc. (NEGG) that are in fast-growing markets but haven't yet secured a dominant position. These are the Question Marks-they demand cash to fuel their growth potential, but the return on that investment isn't locked in yet. Honestly, these units are where the future Stars are either born or they become Dogs, so how you allocate capital here is key.
Expansion into AI-powered workstations and enterprise-level AI hardware fits this quadrant perfectly. The global gaming and AI hardware markets are projected to grow at a compound annual growth rate of 12-15% through 2030, driven by generative AI adoption and the next-gen PC gaming cycle. Newegg Commerce, Inc. is positioning itself to capture this trend, for instance, by mentioning expansion into AI-powered workstations like those featuring the NVIDIA RTX PRO 6000 Blackwell. This is a high-growth area, but Newegg Commerce, Inc.'s current market share in the enterprise hardware space is still developing, meaning significant investment is required to gain traction against established players.
The Newegg Gamer Community and Gamer Zone initiatives are clear examples of high-investment, uncertain-ROI plays designed to build market share through engagement. The Newegg Gamer Zone, which opened on August 26, 2025, is a 2,300-square-foot arena showcasing over $200,000 in state-of-the-art hardware. This physical hub complements the global digital Newegg Gamer Community platform. The strategy here is to foster loyalty and attract new users who will then buy the products showcased, but the direct monetization of this community ecosystem is still being proven out.
Global expansion efforts outside North America also fall into this category. While Newegg Commerce, Inc. is operating globally, specific market share gains in new territories are not yet quantified as dominant. These efforts demand capital for localized marketing, logistics setup, and inventory positioning, all while the long-term return in those specific geographies remains unproven compared to the established North American base. The company's recent moves, like launching a storefront on SHEIN's U.S. Marketplace, suggest an opportunistic approach to new channels, but the long-term financial contribution of these non-core geographic or channel pushes is uncertain.
The 'at the market' (ATM) offering program is the financial mechanism supporting these cash-hungry Question Marks. Newegg Commerce, Inc. established a facility to sell up to $65 million in common shares. As of September 30, 2025, the company had already raised $37.4 million gross proceeds by selling 1,084,290 shares, with 415,710 shares remaining authorized for future sale under the program. This capital is explicitly intended for general corporate purposes and working capital, which directly funds the high-growth, high-cash-burn activities mentioned above.
Here's a quick look at the financial tension: high top-line growth versus the current net loss, which is the classic Question Mark profile demanding a decision on investment.
| Metric | H1 2025 Actual | FY 2025 Guidance Range |
| Net Sales | $695.7 million | $1,375.3-$1,423.9 million |
| GMV | $849.1 million | $1,691.3-$1,751.1 million |
| Net Loss | $(4.2 million) | $(15.8-$10.4 million) |
| Adjusted EBITDA | $11.3 million | $13.7-$19.1 million |
The growth is evident-Net Sales grew 12.6% and GMV grew 13.7% in the first half of 2025-but the company is still guiding for a net loss for the full year 2025, projected between $15.8 million and $10.4 million. This cash burn funds the pursuit of market share in these high-potential areas.
You need to watch the execution on these specific fronts:
- AI Workstations: Capturing enterprise demand for new hardware.
- Gamer Zone/Community: Converting engagement into sales velocity.
- Global Expansion: Proving market viability outside North America.
- ATM Usage: Monitoring how the $37.4 million raised so far is deployed.
If the investment in these areas doesn't rapidly translate into market share gains, the ongoing cash consumption will quickly push these units toward the Dog quadrant, defintely something to monitor closely. Finance: draft 13-week cash view by Friday.
Disclaimer
All information, articles, and product details provided on this website are for general informational and educational purposes only. We do not claim any ownership over, nor do we intend to infringe upon, any trademarks, copyrights, logos, brand names, or other intellectual property mentioned or depicted on this site. Such intellectual property remains the property of its respective owners, and any references here are made solely for identification or informational purposes, without implying any affiliation, endorsement, or partnership.
We make no representations or warranties, express or implied, regarding the accuracy, completeness, or suitability of any content or products presented. Nothing on this website should be construed as legal, tax, investment, financial, medical, or other professional advice. In addition, no part of this site—including articles or product references—constitutes a solicitation, recommendation, endorsement, advertisement, or offer to buy or sell any securities, franchises, or other financial instruments, particularly in jurisdictions where such activity would be unlawful.
All content is of a general nature and may not address the specific circumstances of any individual or entity. It is not a substitute for professional advice or services. Any actions you take based on the information provided here are strictly at your own risk. You accept full responsibility for any decisions or outcomes arising from your use of this website and agree to release us from any liability in connection with your use of, or reliance upon, the content or products found herein.