
|
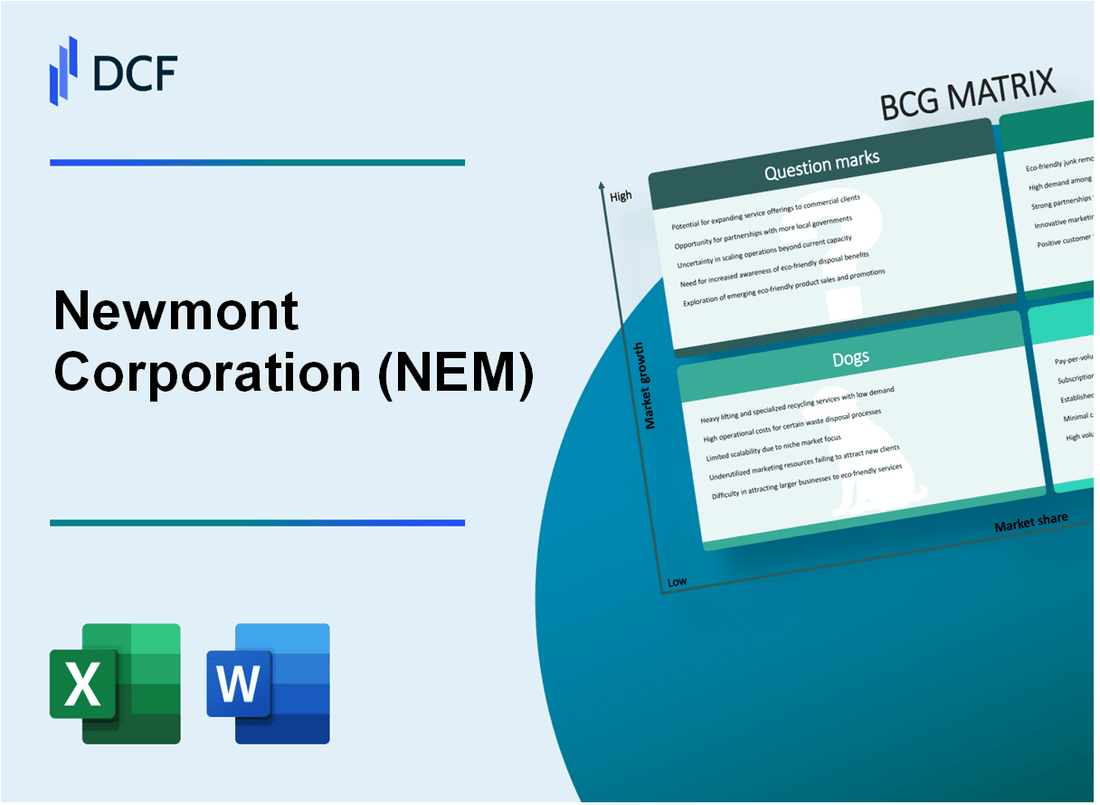
Newmont Corporation (NEM): BCG Matrix [Dec-2025 Updated] |
Fully Editable: Tailor To Your Needs In Excel Or Sheets
Professional Design: Trusted, Industry-Standard Templates
Investor-Approved Valuation Models
MAC/PC Compatible, Fully Unlocked
No Expertise Is Needed; Easy To Follow
Newmont Corporation (NEM) Bundle
You're looking for a clear-eyed view of Newmont Corporation's portfolio post-Newcrest, and the BCG Matrix is defintely the right tool to map where the capital is flowing and why. Honestly, the picture is sharp: high-growth Stars like Ahafo North are being fueled by Cash Cows set to deliver $4.5 billion in free cash flow this year, all while the company successfully shed Dogs for over $3.5 billion in proceeds. But the real tension is in the Question Marks-assets like Lihir and Brucejack need heavy investment to stabilize, especially since the strategic copper business is only 15% of revenue today. Let's dive into where Newmont is investing for that 6 million ounce future and what risks are hiding in plain sight.
Background of Newmont Corporation (NEM)
You're looking at Newmont Corporation (NEM) right at the end of 2025, and honestly, the company's story this year has been one of aggressive portfolio refinement and strong financial delivery. Newmont Corporation, headquartered in Denver, Colorado, remains the world's leading gold mining company, though it also pulls out copper, silver, zinc, and lead from its global operations. As of early December 2025, its market capitalization sits around $98.4 billion, firmly placing it in the large-cap category.
The third quarter of 2025 really capped off a period of strong execution. Newmont reported a net income of $1.8 billion and an adjusted net income of $1.9 billion for that quarter. The operational highlight was generating a record quarterly free cash flow of $1.6 billion, which marked the fourth straight quarter this figure topped $1 billion. This performance pushed the total free cash flow for the year to date to $4.5 billion, setting a new full-year record with one quarter left to report.
The strategic moves made this year have been significant; Newmont has been laser-focused on streamlining its assets to concentrate on what it calls Tier 1 operations. The company completed its major 2025 divestiture program, which included selling off non-core assets like the Akyem operation in Ghana and the Porcupine operation in Canada earlier in the year. In total, the divestiture program is expected to generate over $3.5 billion in after-tax cash proceeds for 2025, part of a larger program totaling up to $4.3 billion in gross proceeds by mid-2025. This disciplined approach has really paid off on the balance sheet; Newmont ended the third quarter in a near 0 debt position after retiring $2 billion of debt, leading Moody's to upgrade its issuer credit rating to A3.
Operationally, Q3 2025 saw attributable gold production of approximately 1.4 million ounces, with copper production coming in at 35 thousand tonnes. The company is seeing returns from its growth pipeline, with commercial production now declared at the Ahafo North mine in Ghana. You should also note the leadership transition underway: CEO Tom Palmer is set to retire at year-end, with President & COO Natascha Viljoen stepping in as the new Chief Executive Officer.
The market has definitely noticed this financial strength and strategic clarity. As of early December 2025, Newmont shares were up 140.5% year-to-date, significantly outpacing the broader materials sector, largely fueled by the rally in gold prices. The company declared a quarterly dividend of $0.25 per share, reinforcing its commitment to shareholder returns alongside its balance sheet reinforcement.
Newmont Corporation (NEM) - BCG Matrix: Stars
You're looking at the growth engines for Newmont Corporation, the assets that demand heavy capital now but promise significant, high-market-share returns as the overall market matures. These are the future Cash Cows, but right now, they are burning cash to secure that leadership position.
The Stars for Newmont Corporation as of 2025 are defined by their high growth potential, driven by major project completions and expansions that secure long-term, leading production volumes. These assets are central to the company's ambition to maintain a production base near the 6 million ounce annual target over the next decade, even as the 2025 guidance for the core Tier 1 Portfolio sits at 5.6 million ounces attributable gold production.
These units require elevated development capital, which is reflected in the overall 2025 development capital guidance of $1.3 billion. Still, the investment is strategic, aiming to solidify Newmont's leadership in key jurisdictions.
Here's a breakdown of the key assets fitting the Star profile:
- Ahafo North (Ghana) is now operational, a high-growth asset.
- Tanami Expansion 2 (Australia) is nearing its production ramp-up phase.
- Red Chris Block Cave (Canada) aligns with long-term copper demand trends.
The capital intensity is real; for instance, sustaining capital spending is expected to remain elevated at $1.8 billion through the next few years.
You can see the expected contribution and scale of these growth projects in the table below:
| Asset | Market Position/Growth Driver | Key 2025/Near-Term Metric | Long-Term Projection/Life |
| Ahafo North (Ghana) | New, world-class asset achieving commercial production in 2025. | Expected to produce approximately 50,000 ounces of gold in 2025. | Forecasted to deliver 275,000 to 325,000 ounces annually over the next five years, with a 13-year mine life. |
| Tanami Expansion 2 (Australia) | Secures long-life, low-cost production via a new hoisting shaft. | Commercial production expected in the second half of 2025. Total capital costs estimated between $1.2 and $1.3 billion. | Expected to increase average annual gold production by approximately 150,000 to 200,000 ounces per year for the first five years (2028-2032), extending life beyond 2040. |
| Red Chris Block Cave (Canada) | Key copper-gold development aligning with high-growth copper demand. | FY23 production was 18 Metric Kt of copper and 39 thousand ounces of gold. Development capital forecast for 2025 saw a $50 million decrease. | The block cave method is anticipated to extend the mine's life by about 15 years (construction and production). |
Ahafo North's immediate contribution in 2025 is modest as it ramps up, but its long-term output of up to 325,000 ounces annually is crucial for replacing ounces from divested assets, such as the Akyem mine divested in April 2025. Tanami Expansion 2's ramp-up in the latter half of 2025 is also designed to support the overall production profile. If Newmont successfully keeps market share in these high-growth areas, they will transition into the Cash Cow quadrant when the market growth rate naturally slows down.
Finance: draft 13-week cash view by Friday.
Newmont Corporation (NEM) - BCG Matrix: Cash Cows
The Total Core Tier 1 Portfolio is the main engine, guided to produce 5.6 million gold ounces in 2025. These established assets, representing the company's highest quality base, are managed for consistent, low-cost output, with All-in Sustaining Costs (AISC) for the core portfolio targeted at approximately $1,620 per ounce. This cost positioning ensures wide margins, defintely, in the current high gold price environment, making these operations the primary source of internal funding.
Strong execution is driving a record target of $4.5 billion in free cash flow (FCF) for the full year 2025. Cash Cows are the business units that generate more cash than they consume, providing the necessary capital to fund development projects, service corporate obligations, and return capital to shareholders. For instance, Newmont Corporation generated a third-quarter record of $1.6 billion in free cash flow in Q3 2025, marking the fourth consecutive quarter above $1 billion.
You need to see how these cash generators are supported to maintain their productivity:
- Total Core Tier 1 Portfolio production guidance for 2025 is 5.6 million gold ounces.
- Nevada Gold Mines (NGM) joint venture output is expected to be a primary driver of increased production in the second half of 2025.
- Sustaining capital spend for the Total Tier 1 Portfolio is guided at approximately $1.8 billion for 2025.
- The core portfolio's AISC is projected at $1,620 per ounce for the full year 2025.
Here's a quick look at the financial scaffolding supporting these cash cows:
| Metric | Value/Amount | Context/Period |
| Target Full Year FCF | $4.5 billion | 2025 Target |
| Core Portfolio AISC | $1,620 per ounce | Full Year 2025 Guidance |
| NGM Q3 2025 AISC | $1,502 per ounce | Q3 2025 Actuals |
| Total Tier 1 Portfolio Sustaining Capital | $1.8 billion | 2025 Guidance |
Newmont Corporation (NEM) - BCG Matrix: Dogs
You're looking at the assets Newmont Corporation has actively moved away from, the ones that didn't fit the new, streamlined Tier 1 portfolio. These are the classic Dogs-low market share in markets that weren't providing the competitive returns the company now demands. Honestly, these were the operations that were tying up valuable management attention and capital.
The six non-core operations and two projects that were divested in 2025, like Akyem in Ghana and Porcupine in Canada, were definitely on the higher-cost, smaller-mine end of the spectrum. Newmont completed its divestiture program in April 2025, generating over $3.5 billion in net cash proceeds to pay down debt. That's a significant chunk of cash flow reallocation, moving away from assets that didn't meet the new standard.
To be fair, the focus is now entirely on the core. For instance, Yanacocha in Peru, while a major historical asset, is concluding its current mining phase in Q4 2025, effectively phasing out a major gold operation as the company pivots toward the future Sulfides project development, which itself saw its investment decision deferred. These assets were consuming management time and capital without providing a competitive return, which is the textbook reason to categorize them as Dogs.
Here's a quick look at the major divestiture components that defined this category for Newmont in 2025:
| Divested Asset Group | Sale Completion Timing | Cash Proceeds (Approximate, Before Adjustments) |
| Akyem (Ghana) and Porcupine (Canada) | April 2025 | $850 million after-tax cash proceeds |
| Musselwhite, Éléonore (Canada), and CC&V (US) | February 2025 | $1.7 billion in cash proceeds |
| Total Non-Core Divestitures (Cash) | H1 2025 | Over $2.5 billion net cash proceeds received year-to-date |
| Total Gross Proceeds (Non-Core + Other Investments) | Program End | Up to $4.3 billion total gross proceeds |
The strategy here was clear: shed assets that were not Tier 1. The divestiture program, announced in February 2024, targeted assets that failed to meet that high bar. The cash generated, which included the aforementioned $3.5 billion, was earmarked for balance sheet strengthening and returning capital to shareholders, which you see reflected in the latest figures. Newmont ended the latest quarter with cash of $6.2 billion, and its long-term debt of $7.1 billion is a low 7.7% of its market cap. That's the direct financial impact of moving these Dogs out of the portfolio.
- Divested all six non-core operations from the 2024 program.
- Akyem and Porcupine sales finalized in April 2025.
- Proceeds used to strengthen the balance sheet.
- Assets were higher-cost and smaller operations.
Finance: draft 13-week cash view by Friday.
Newmont Corporation (NEM) - BCG Matrix: Question Marks
You're looking at the assets that are currently burning cash but hold the key to Newmont Corporation's future growth-the Question Marks. These are the high-growth market plays where the company has a low current market share, meaning they consume capital now hoping to become tomorrow's Stars. Honestly, these units are a balancing act between heavy investment and potential divestiture.
The primary challenge across these assets is the immediate drag on performance while Newmont Corporation works through operational hurdles. You need to see where the capital is going and what the near-term production reality looks like. Here's the quick math on the key assets currently classified here:
- Lihir (Papua New Guinea) is processing lower-grade stockpiles in 2025.
- Brucejack (Canada) production is projected to be 100,000 ounces lower than initial guidance.
- Cadia (Australia) requires significant sustaining capital for tailings work.
- The copper portfolio needs heavy investment to grow its market share.
Take Lihir, for example. Following the Newcrest acquisition, Newmont Corporation expects its 2025 gold production from this site to be around 600 Koz (thousand ounces). This is happening because the operation is working through lower-grade stockpiles this year, which is a direct result of open pit reconfiguration aimed at a more sustainable long-term mine plan. This temporary dip in output, driven by necessary reconfiguration, is classic Question Mark behavior-a necessary cash burn for future stability.
Brucejack is another clear example of a high-growth market facing immediate execution risk. The stabilization issues there mean 2025 production is projected to be 100,000 ounces below what the company initially guided back in February 2025. The mine is transitioning to an open-pit property, which is causing a production decrease in the second half of 2025. This asset is in a growing market, but its current low share, due to these transition costs and output misses, puts it squarely in this quadrant.
Cadia, a Tier 1 copper-gold asset, also fits the profile due to its capital demands. Its gold production is expected to drop by approximately 40 percent in 2025 as it transitions to Panel Cave 2-3. To enable the full scale-up, which is anticipated to start driving production growth again in 2027, significant sustaining capital is needed for tailings work, specifically the Cadia Southern Tailings Storage Facility Expansion (STSFX). This need for heavy, near-term capital expenditure to unlock future potential is what defines a Question Mark.
The broader copper exposure highlights the strategic investment required. While copper is a high-growth sector, Newmont Corporation's overall copper portfolio only accounts for about 15% of revenue, as outlined in the strategic assessment. [cite: User-provided outline] To gain meaningful market share in that sector, heavy investment is necessary, which aligns with the cash-consuming nature of Question Marks. For context, gold still dominates the revenue picture, making up 86.2% of total revenue in the second quarter of 2025. The total sustaining capital guidance for the entire Tier 1 Portfolio in 2025 is set at approximately $1.8 billion, much of which supports these critical infrastructure projects like Cadia's tailings work.
You're looking at a portfolio where the decision is clear: invest heavily to capture that growth, or decide the risk outweighs the potential return and sell. The immediate financial impact is negative cash flow, but the long-term prize is moving these assets into the Star category.
| Asset/Portfolio | 2025 Production Impact/Status | Key Financial/Statistical Data Point |
| Brucejack (Canada) | Production projected 100,000 ounces lower than initial guidance. | Transitioning to open-pit property causing production decrease in H2 2025. |
| Lihir (Papua New Guinea) | Expected gold production of 600 Koz for 2025. | Processing lower-grade stockpiles due to open pit reconfiguration. |
| Cadia (Australia) | Gold production expected to decrease by approximately 40 percent in 2025. | Requires significant sustaining capital for the STSFX tailings expansion. |
| Copper Portfolio | Strategic but currently low revenue contributor. | Represents about 15% of revenue. [cite: User-provided outline] |
Finance: draft the capital allocation impact report for Lihir and Cadia by next Tuesday.
Disclaimer
All information, articles, and product details provided on this website are for general informational and educational purposes only. We do not claim any ownership over, nor do we intend to infringe upon, any trademarks, copyrights, logos, brand names, or other intellectual property mentioned or depicted on this site. Such intellectual property remains the property of its respective owners, and any references here are made solely for identification or informational purposes, without implying any affiliation, endorsement, or partnership.
We make no representations or warranties, express or implied, regarding the accuracy, completeness, or suitability of any content or products presented. Nothing on this website should be construed as legal, tax, investment, financial, medical, or other professional advice. In addition, no part of this site—including articles or product references—constitutes a solicitation, recommendation, endorsement, advertisement, or offer to buy or sell any securities, franchises, or other financial instruments, particularly in jurisdictions where such activity would be unlawful.
All content is of a general nature and may not address the specific circumstances of any individual or entity. It is not a substitute for professional advice or services. Any actions you take based on the information provided here are strictly at your own risk. You accept full responsibility for any decisions or outcomes arising from your use of this website and agree to release us from any liability in connection with your use of, or reliance upon, the content or products found herein.