
|
Neoen S.A. (NEOEN.PA): Porter's 5 Forces Analysis |
Fully Editable: Tailor To Your Needs In Excel Or Sheets
Professional Design: Trusted, Industry-Standard Templates
Investor-Approved Valuation Models
MAC/PC Compatible, Fully Unlocked
No Expertise Is Needed; Easy To Follow
Neoen S.A. (NEOEN.PA) Bundle
In the fast-evolving landscape of renewable energy, Neoen S.A. faces a unique blend of challenges and opportunities that shape its competitive strategy. Understanding the dynamics of Michael Porter’s Five Forces—bargaining power of suppliers, bargaining power of customers, competitive rivalry, threat of substitutes, and threat of new entrants—provides valuable insight into how this innovative company navigates its market. Dive deeper to discover how these forces influence Neoen's business decisions and future growth potential.
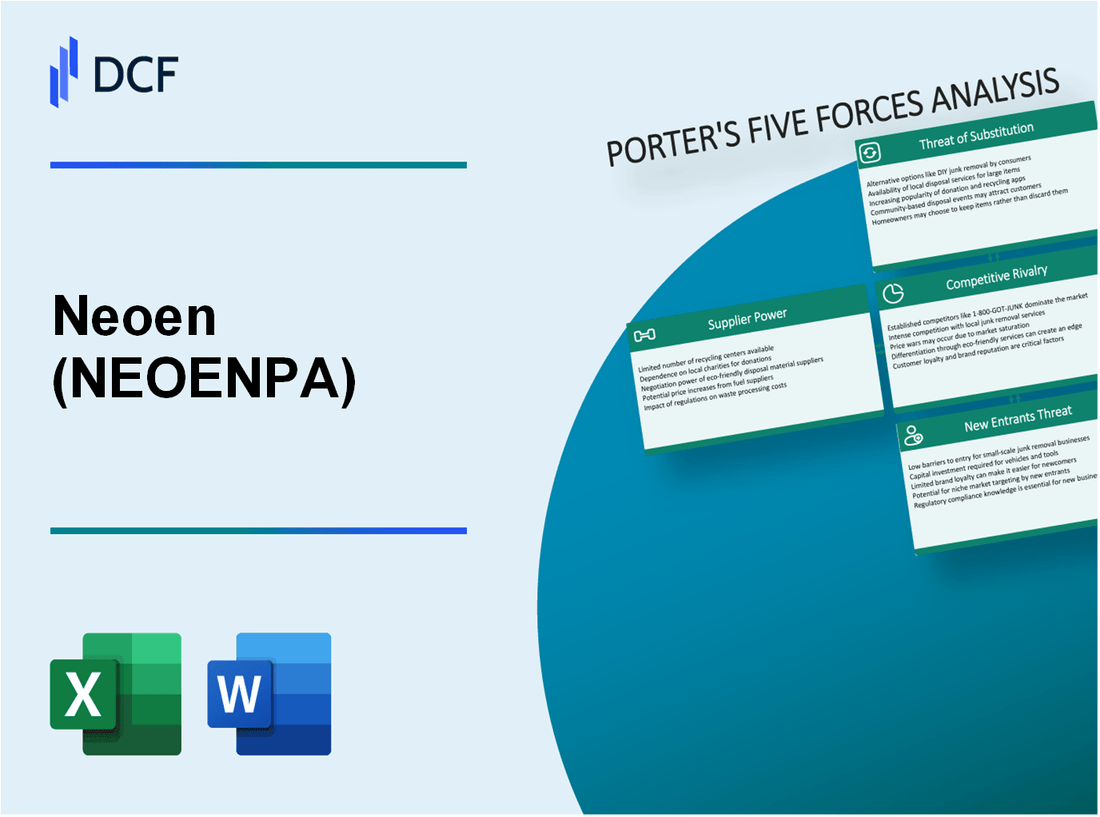
Neoen S.A. - Porter's Five Forces: Bargaining power of suppliers
The renewable energy industry, particularly as it pertains to Neoen S.A., is characterized by a relatively limited pool of suppliers in specific technology segments. The global market for renewable energy technologies, such as solar panels and wind turbines, is dominated by a few key manufacturers, leading to a concentrated supplier base. For instance, as of 2023, the top five solar panel manufacturers control approximately 60% of the market share.
Neoen's operations heavily rely on specialized equipment. The procurement of high-quality components such as photovoltaic (PV) modules and inverters is critical, where suppliers like First Solar, Canadian Solar, and Siemens Gamesa hold significant market power. The dependency on these suppliers becomes evident when examining Neoen's supply chain, as they are integral to maintaining project schedules and performance standards. In 2022, Neoen reported that around 75% of its procurement was allocated to such specialized suppliers.
Additionally, the availability of alternative suppliers for specific components is often limited. For example, the inverter market is predominantly controlled by a few players like SMA Solar Technology and ABB, which makes it challenging for Neoen to switch suppliers without incurring additional costs. This dependency could lead to increased operational risks and costs if these suppliers raise prices or encounter supply chain disruptions.
However, Neoen's strategy includes measures to mitigate supplier power through vertical integration in certain areas. The company has pursued partnerships and joint ventures aimed at enhancing its self-sufficiency in key components, which can reduce the overall bargaining power of suppliers. In its 2022 financial report, Neoen highlighted a 15% increase in in-house produced components compared to the previous year, indicating proactive steps to lessen reliance on external suppliers.
Finally, Neoen often engages in long-term contracts with key suppliers, which can stabilize supplier relationships and provide price predictability. As of 2023, approximately 65% of Neoen's supplier agreements were structured as long-term contracts, ensuring a more stable cost structure amidst market volatility. These contracts may include price caps or fixed pricing strategies, further mitigating the impact of supplier power.
| Supplier Type | Market Share (%) | Neoen Procurement (%) | Long-term Contracts (%) |
|---|---|---|---|
| Top Solar Panel Manufacturers | 60 | 75 | 65 |
| Inverter Market Leaders | 40 | N/A | N/A |
| Vertical Integration Components | 15 | 15 | N/A |
In conclusion, while Neoen S.A. faces challenges from supplier power due to limited suppliers and high dependency on specialized equipment, its strategies like vertical integration and long-term contracts help mitigate these pressures. Understanding these dynamics is crucial for navigating the competitive landscape of the renewable energy sector.
Neoen S.A. - Porter's Five Forces: Bargaining power of customers
The renewable energy sector is experiencing a significant shift, with a growing demand for sustainable energy options. According to the International Renewable Energy Agency (IRENA), global demand for renewable energy sources is projected to reach 27% of the total energy mix by 2025, up from 22% in 2020. This trend indicates that customers are increasingly prioritizing sustainable energy solutions.
Neoen S.A. operates in a competitive landscape where customers can choose between multiple renewable providers. In Europe, over 1,000 renewable energy companies are actively offering various energy solutions, increasing buyer options. This accessibility empowers customers with choices, pressuring providers like Neoen to maintain competitive pricing and innovative solutions.
Corporate customers often exhibit high bargaining power due to large-scale energy consumption. For instance, in 2021, corporate Power Purchase Agreements (PPAs) accounted for approximately 63% of all renewable energy contracts in the U.S., as per the Renewable Energy Buyers Alliance (REBA). This trend underscores the significant leverage corporate clients hold when negotiating contracts with energy providers.
Residential consumers demonstrate varying levels of price sensitivity influenced by local energy costs. For example, in Australia, household electricity prices rose by 8.3% in 2020, prompting increased interest in alternative suppliers. Research indicates that approximately 40% of consumers surveyed would switch to a provider offering a lower price, highlighting their sensitivity to cost changes.
Customized energy solutions further create differentiation in the market. Neoen, for instance, specializes in tailored renewable energy projects which can command a premium. In 2022, Neoen secured contracts that included specific customer requirements, contributing to a projected revenue increase of 15% year-over-year.
| Key Metrics | Data |
|---|---|
| Projected Renewable Energy Demand (2025) | 27% |
| Number of Renewable Energy Companies in Europe | 1,000+ |
| Corporate PPAs Market Share (U.S., 2021) | 63% |
| Residential Price Sensitivity (Australia, 2020) | 40% willing to switch |
| Projected Revenue Increase (Neoen, 2022) | 15% |
Neoen S.A. - Porter's Five Forces: Competitive rivalry
The renewable energy sector is characterized by intense competition. Neoen S.A. finds itself amidst several significant players including Ørsted, NextEra Energy, and Engie, each vying for market share. The growth of renewables has attracted both established energy firms and new entrants, making the landscape increasingly competitive. In 2022, the global renewable energy market was valued at approximately $1.5 trillion and is projected to reach $2.5 trillion by 2027, growing at a CAGR of 10.5%.
Price wars are prevalent in such highly competitive markets. Companies are under constant pressure to lower costs to remain competitive. For instance, solar power costs have dropped by approximately 89% since 2009, which has forced companies to adopt leaner operational models. In 2023, the average Levelized Cost of Energy (LCOE) for solar has decreased to around $30 per MWh, compelling rivals to match or exceed these prices to capture consumer interest.
Innovation plays a crucial role in this sector, driving competition through technological advancements. Neoen, for instance, invests significantly in energy storage technologies, with the global battery energy storage market expected to grow from approximately $9 billion in 2020 to $22 billion by 2026. Companies investing in cutting-edge technology can provide more efficient and reliable services, thus gaining a competitive edge.
Competitive offers and value-added services are essential. Neoen has been able to differentiate itself by offering hybrid energy solutions that combine solar and storage. In Q3 2023, Neoen secured contracts totaling €350 million with various clients for such innovative solutions. This customer-focused approach not only enhances long-term loyalty but also ensures a stable revenue stream amidst fierce competition.
Branding efforts are crucial for capturing and maintaining market share. In 2022, Neoen reported a brand recognition increase of 40% in target markets, primarily due to strategic marketing campaigns and partnerships. This is significant considering the low customer loyalty often found in the energy sector, where consumers can easily switch providers. High-profile projects, such as the Hornsdale Power Reserve, have further solidified its market position, showcasing its capabilities and reliability.
| Competitor | Market Share (%) | 2022 Revenue (in $ billion) | Key Strengths |
|---|---|---|---|
| Neoen S.A. | 8% | 0.45 | Hybrid solutions, strong growth in energy storage |
| Ørsted | 10% | 5.24 | Strong offshore wind portfolio |
| NextEra Energy | 14% | 19.20 | Largest solar provider in the U.S. |
| Engie | 9% | 28.36 | Diverse energy portfolio, global reach |
| EDF Renewables | 7% | 17.00 | Strong presence in wind energy |
Neoen S.A. - Porter's Five Forces: Threat of substitutes
The threat of substitutes for Neoen S.A. is significant due to various energy sources available in the market that can replace renewable energy. Understanding these alternatives is crucial for assessing competitive pressures in the renewable energy sector.
Fossil fuel energy as a primary substitute
Fossil fuels, including coal, natural gas, and oil, remain primary substitutes for renewable energy sources. In 2021, fossil fuels accounted for approximately 81% of global energy consumption, with renewable sources comprising only 11%. The price of natural gas has shown considerable volatility; as of October 2023, the average natural gas price in the US was around $3.00 per MMBtu, influenced by supply chain dynamics and geopolitical factors.
Energy storage solutions offer alternative options
Advancements in energy storage technology present viable alternatives to renewable energy. The global energy storage market is projected to grow from $8.1 billion in 2022 to $24.2 billion by 2027, representing a CAGR of 24.9%. Battery storage solutions, particularly lithium-ion batteries, are becoming increasingly competitive with traditional energy sources, offering flexibility and reliability for consumers.
Energy efficiency improvements reduce consumption
Energy efficiency measures can significantly reduce the demand for energy, acting as a substitute for renewable energy services. In 2022, investments in energy efficiency globally reached approximately $277 billion. These investments have helped reduce energy consumption and associated costs, affecting the demand for both renewable and fossil fuel energy sources.
Government incentives favor renewable over substitutes
Government policies increasingly support renewable energy through subsidies and tax incentives. For instance, in the US, federal tax credits for renewable energy investments, such as the Investment Tax Credit (ITC), provide up to 30% of project costs as a tax credit. This support enhances the competitiveness of renewables against fossil fuel substitutes.
Consumer preference shifting towards clean energy
Consumer trends indicate a noticeable shift towards renewable energy. A 2023 survey by the International Energy Agency revealed that 75% of consumers are willing to pay a premium for clean energy sources. Furthermore, the global renewable energy market is expected to reach a value of $2 trillion by 2025, driven by this consumer preference.
| Substitute Source | Market Share (%) | Average Price (USD) | Growth Rate (%) |
|---|---|---|---|
| Fossil Fuels | 81 | $3.00 (Natural Gas) | - |
| Energy Storage Solutions | Estimated 10 | $400 per kWh (Lithium-Ion) | 24.9 |
| Energy Efficiency Investments | - | - | 5.5 (Global Average) |
| Renewable Energy Market | 11 | - | 12.2 |
Neoen S.A. - Porter's Five Forces: Threat of new entrants
The threat of new entrants in the renewable energy sector, particularly for Neoen S.A., hinges on several critical factors that affect market dynamics.
High capital requirements for infrastructure setup
Entering the renewable energy sector demands substantial capital investment. For example, the average cost of setting up a solar photovoltaic plant can range from €1 million to €3 million per megawatt (MW) in Europe. Neoen reported that its total assets stood at approximately €3.9 billion as of December 2022, reflecting the significant initial investment in infrastructure necessary to compete in this industry.
Regulatory challenges and compliance barriers
New entrants face complex regulatory frameworks that vary by country. In France, where Neoen is headquartered, obtaining necessary permits and navigating environmental regulations can take several years. The International Renewable Energy Agency (IRENA) indicates that regulatory requirements can increase project timelines by up to 20%, which can significantly impact financial viability.
Established brand and customer loyalty deter new entrants
Neoen's established market presence and proven track record in the renewable energy sector create a formidable barrier to entry. As of 2023, Neoen has achieved an operational capacity of 3.5 GW across various projects, fostering strong relationships with clients and investors. This established brand reputation can dissuade new companies from entering the market, as customers often prefer reliable, reputable providers.
Economies of scale benefit existing companies
Existing players like Neoen benefit from economies of scale, reducing per-unit costs. Neoen's reported average production cost for solar energy is around €40/MWh, significantly lower than potential new entrants who may not achieve similar cost efficiency until they reach a comparable scale. With a robust portfolio and a significant market share, Neoen can leverage its size to negotiate better pricing for materials and services.
Technological advancements can lower entry barriers
While high capital requirements pose a challenge, advancements in technology are gradually lowering barriers to entry. For instance, the cost of solar photovoltaic technology has fallen by about 82% since 2010, according to IRENA. As these technologies become more accessible, new entrants may find it easier to establish themselves in the market, albeit still facing competition from established firms like Neoen.
| Factor | Impact on New Entrants | Statistics |
|---|---|---|
| Capital Requirements | High | Average cost to set up solar: €1M - €3M per MW |
| Regulatory Challenges | High | Regulatory requirements can increase project timelines by 20% |
| Brand Loyalty | High | Operational capacity of Neoen: 3.5 GW |
| Economies of Scale | High | Average production cost for Neoen: €40/MWh |
| Technological Advancements | Medium | Cost of solar PV technology down by 82% since 2010 |
In the dynamic landscape of renewable energy, Neoen S.A. navigates a complex interplay of forces, from the bargaining power of suppliers to the ever-present threat of new entrants. Understanding these factors through Porter's Five Forces provides a strategic lens for assessing Neoen's position and adaptability within a competitive market, ultimately shaping its path for sustainable growth and innovation.
[right_small]Disclaimer
All information, articles, and product details provided on this website are for general informational and educational purposes only. We do not claim any ownership over, nor do we intend to infringe upon, any trademarks, copyrights, logos, brand names, or other intellectual property mentioned or depicted on this site. Such intellectual property remains the property of its respective owners, and any references here are made solely for identification or informational purposes, without implying any affiliation, endorsement, or partnership.
We make no representations or warranties, express or implied, regarding the accuracy, completeness, or suitability of any content or products presented. Nothing on this website should be construed as legal, tax, investment, financial, medical, or other professional advice. In addition, no part of this site—including articles or product references—constitutes a solicitation, recommendation, endorsement, advertisement, or offer to buy or sell any securities, franchises, or other financial instruments, particularly in jurisdictions where such activity would be unlawful.
All content is of a general nature and may not address the specific circumstances of any individual or entity. It is not a substitute for professional advice or services. Any actions you take based on the information provided here are strictly at your own risk. You accept full responsibility for any decisions or outcomes arising from your use of this website and agree to release us from any liability in connection with your use of, or reliance upon, the content or products found herein.