
|
National Grid plc (NGG): 5 FORCES Analysis [Nov-2025 Updated] |
Fully Editable: Tailor To Your Needs In Excel Or Sheets
Professional Design: Trusted, Industry-Standard Templates
Investor-Approved Valuation Models
MAC/PC Compatible, Fully Unlocked
No Expertise Is Needed; Easy To Follow
National Grid plc (NGG) Bundle
You're looking for a clear-eyed view of National Grid plc's competitive position, so let's break down the Five Forces, focusing on the massive capital program and the regulatory environment that shapes their whole business. Honestly, while the core transmission and distribution business enjoys low direct rivalry thanks to those exclusive licenses, the real story for late 2025 is the sheer scale of investment-think nearly £10 billion poured in during FY2025 alone-and how that massive spend interacts with regulators and a tight supply chain. We need to see where the leverage truly sits: is it with the powerful, specialized suppliers or the proxy buyers like Ofgem, especially given the £59 billion supply chain commitment? Dive in below to see the precise pressure points across all five forces.
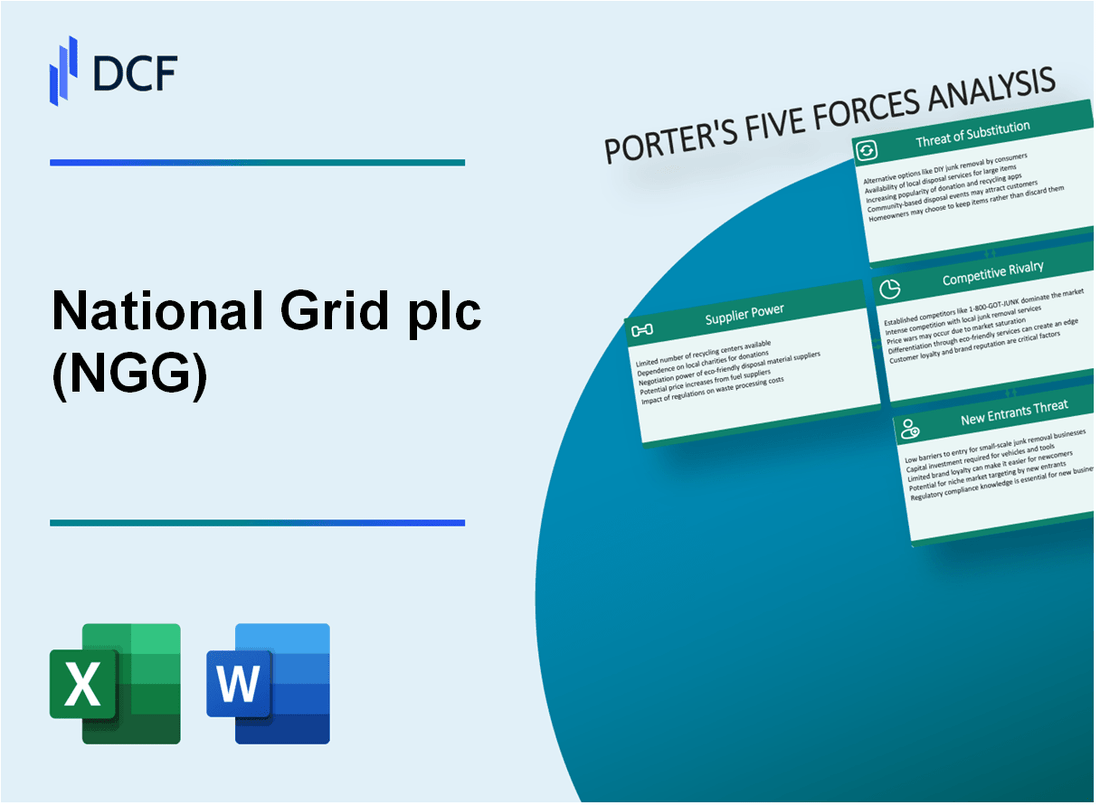
National Grid plc (NGG) - Porter's Five Forces: Bargaining power of suppliers
You're looking at National Grid plc's massive capital expenditure program, and it immediately signals where the leverage lies in its supplier relationships. The specialized nature of high-voltage direct current (HVDC) equipment and the complex civil works required for The Great Grid Upgrade mean that a small pool of highly capable contractors holds significant power over National Grid plc's execution timeline and costs.
Major suppliers hold leverage due to the specialized nature of high-voltage equipment and civil works. This isn't about buying standard components; it's about securing world-class technology for a grid overhaul. National Grid plc has strategically tried to lock in capacity through massive, multi-year agreements, but this very act solidifies long-term reliance on these key players.
NGG's £59 billion supply chain framework commitment necessitates long-term reliance on a few key contractors. This framework, launched in 2023, is designed to secure critical equipment for confirmed and anticipated projects over a five-year period, with an option to extend for a further three years. This structure inherently limits National Grid plc's ability to quickly switch providers if disputes arise or costs escalate.
Here's the quick math on how that £59 billion framework is structured across the specialized equipment categories:
| Framework Component | Approximate Value | Number of Awarded Suppliers |
|---|---|---|
| HVDC Cable Supply Framework | £21.3 billion | Six |
| HVDC Converter Systems Framework | £24.6 billion | Four |
| HVDC Civil Works Supply Framework (Total) | £12 billion | Nine (across two lots) |
The concentration in the equipment supply is quite stark. For the converter systems, which are highly complex, National Grid plc awarded positions to just four suppliers: GE Vernova, Hitachi Energy, Mitsubishi Electric, and Siemens Energy. Similarly, the cable framework involves only six primary partners.
Global supply chain uncertainties and inflation increase the cost of capital projects like the £10 billion invested in FY2025. That record investment for the year ended March 31, 2025, was made into a market environment where securing capacity is paramount. Any inflationary pressure on raw materials or logistics directly impacts the cost base for these long-term framework contracts, giving suppliers room to negotiate price escalations, even within the agreed structures.
The bargaining power is further amplified by the shortage of specialized talent for energy transition projects, which creates upward pressure on labor costs, particularly for the civil works component. While National Grid plc has secured the equipment supply, the physical construction and installation require specialized skills that are in high demand across the entire infrastructure sector. This is evident in the civil works awards, where capacity was spread across specific lots:
- HVDC converter civil works (Lot 1): £9.07 billion awarded to six firms.
- HVDC onshore cable civils (Lot 2): £3.7 billion awarded to three firms.
- One supplier, Sumitomo, is building new HVDC cable manufacturing facilities in the UK for the first time in over 20 years, indicating a significant, long-term dependency on external capacity build-out.
To be fair, National Grid plc has managed to secure over three-quarters of its total £60 billion five-year investment plan through these frameworks, which helps mitigate some immediate risk. Still, the power of these specialized, long-term partners remains a critical factor in the successful, on-time delivery of the required network upgrades.
National Grid plc (NGG) - Porter's Five Forces: Bargaining power of customers
Power is low for individual customers because National Grid plc operates within a regional monopoly structure for transmission and distribution assets in its service territories. For instance, its Niagara Mohawk Power Corporation (NIMO) business in Upstate New York serves 1.7 million electric and 600,000 gas customers, none of whom have an alternative network provider to switch to for basic delivery service.
Regulators act as the primary proxy buyers, setting the financial terms under which National Grid plc can operate and earn a return. This power is evident in the allowed Return on Equity (ROE) determinations. In a recent New York rate case for NIMO, the approved rate plan included an allowed ROE of 9.5% for the period spanning May 2025 through March 2028. This contrasts with the UK, where Ofgem's RIIO-ET3 draft determination proposed a CPIH-real allowed return of 4.49% for National Grid Electricity Transmission (NGET), which was below the company's requested 6.3% real return.
Here's a quick look at the regulatory return landscape:
| Jurisdiction/Entity | Metric | Requested/Target Value | Approved/Determined Value (Late 2025) |
|---|---|---|---|
| New York (NIMO) | Allowed Return on Equity (ROE) | Not specified in proposal | 9.5% |
| UK (NGET) | Requested Real Return on Equity | 6.3% | 4.49% (Draft Determination) |
| UK (Network Operators General) | Requested Real Return on Equity (at 55% gearing) | Around 6% | Ofgem July 2024 guidance range: 4.24% to 5.82% |
Regulatory pressure also directly mandates customer support expenditures, shifting costs and obligations onto the utility. The New York settlement, for example, requires National Grid plc to fund more than $290 million in bill discounts for vulnerable Upstate New Yorkers over the three-year plan, with approximately $72 million allocated in the first year alone. Furthermore, the plan included an up to $3 million shareholder-funded health and safety weatherization program.
Large industrial customers, while lacking an alternative network provider, can exert pressure through the regulatory process by participating as formal intervenors. The New York Public Service Commission's unanimous approval of the joint proposal on August 14, 2025, demonstrated this collective leverage. The final approved revenue request was significantly curtailed compared to National Grid plc's initial filing:
- Total electric delivery revenue reduction: Over $340 million (a 67% decrease from the request) in the first year.
- Total gas delivery revenue reduction: Nearly $100 million (a 63% decrease from the request) in the first year.
This outcome shows that while individual customers have negligible direct power, organized groups, including large commercial entities that signed the joint proposal, can significantly shape the financial outcomes imposed on National Grid plc by the regulators.
National Grid plc (NGG) - Porter's Five Forces: Competitive rivalry
For National Grid plc (NGG), the intensity of competitive rivalry in its core business is structurally low. Direct rivalry within its exclusive operating territories for transmission and distribution is constrained because these are regulated monopolies granted by the relevant authorities. You see this reflected in the focus on asset growth rather than market share battles in these areas. The company's regulated asset growth in the year ended March 31, 2025, was 10.5%, significantly outpacing the overall Group asset growth of 9.0%. This regulated focus underpins the multi-year strategy.
However, competition definitely heats up in the non-regulated segments where National Grid Ventures (NGV) operates. NGV is building and operating infrastructure like subsea electricity interconnectors, competitive electricity transmission projects, and battery storage across the UK, Europe, and the US. While NGV has committed capital expenditure of around £1 billion over the five years to 2028/2029, this segment faces rivalry from other developers and operators in these merchant markets.
The most intense rivalry National Grid plc faces is for capital funding itself. The company is executing an ambitious five-year capital investment plan totaling approximately £60 billion through FY2029. This massive outlay, nearly double the investment of the prior five years, puts National Grid plc in direct competition for financing, talent, and supply chain capacity against other large, capital-hungry utilities like NextEra Energy and Duke Energy, all vying to fund the energy transition. This capital intensity is the defining feature of the current environment, driving the focus on a targeted regulated asset base (RAB) growth of around 10% CAGR through March 2029.
Here's a quick look at the scale of the investment driving this capital competition:
| Investment Metric | Value/Target | Timeframe/Baseline |
|---|---|---|
| Five-Year Cumulative Capital Investment | £60 billion | To the end of March 2029 |
| Targeted Group Asset Growth CAGR | Around 10% | Through to 2028/29 |
| Regulated Asset Growth (FY2024/25) | 10.5% | Year ended March 31, 2025 |
| Capital Investment (FY2024/25) | Almost £10 billion | Year ended March 31, 2025 |
| NGV Committed Capex | Around £1 billion | Over five years to 2028/29 |
| US Regulated Investment (NY & NE) | Around £28 billion (£17B + £11B) | Over five years to 2028/29 |
The rivalry for capital is also managed through portfolio streamlining to maintain financial strength. For example, the company completed the sale of its US onshore renewables business for cash proceeds of $2.1 billion. This strategic divestment, alongside the sale of Grain LNG for cash proceeds of £1.66 billion, helps fund the core regulated growth strategy. The goal is to deliver an underlying Earnings Per Share (EPS) CAGR of 6-8% from the FY2025 baseline of 73.3p.
The competitive pressures manifest in several key areas that you need to watch:
- Securing supply chain frameworks for major projects.
- Managing regulatory outcomes, like the RIIO-T3 price control.
- Attracting and retaining the specialized engineering talent needed for the £60 billion plan.
- Balancing debt levels while funding high growth, with net debt at £41.4 billion as of March 31, 2025.
National Grid plc (NGG) - Porter's Five Forces: Threat of substitutes
You're looking at how customers can bypass or reduce their need for National Grid plc's core transmission and distribution services. This threat is material, driven by decentralized energy and efficiency gains. Honestly, the shift is happening faster than some legacy models predict.
Distributed generation, like rooftop solar and wind farms, directly reduces the volume of power that needs to travel across National Grid plc's wires. The National Energy System Operator estimates that distribution-connected generation, which is mostly renewables, could balloon from about 30 GW currently to a range of 80 GW to 140 GW by 2050. Just look at the US side: solar generation hit 303 TWh in 2024, a massive increase of 64 TWh from the prior year. For National Grid plc specifically, they connected 2.2 GW of renewable generation in the UK in the fiscal year ending March 2025, which included 1.2 GW from the Dogger Bank offshore wind farm.
Energy efficiency programs and smart grid technology chip away at overall demand, meaning less capacity is needed on the wires. In Great Britain, for example, median domestic electricity consumption in 2023 was 7% lower than it was in 2021. Looking longer-term, median electricity consumption was 31% lower in 2023 compared to 2005 levels. The potential for demand-side management is huge; the government's Smart Systems and Flexibility Plan projected that increased flexibility could save the total system £6-£10 billion per year leading up to 2050. Furthermore, consumer-led flexibility could cut required distribution network investment by about 15%. Still, not all efficiency efforts are guaranteed; the UK's ECO energy efficiency scheme is slated to end in April 2026.
Battery storage solutions give large commercial and industrial customers the ability to manage their own peak loads, which lessens reliance on the grid during critical times. The UK Stationary Battery Storage Industrial Market was valued at approximately USD 443.9 million in 2025. Globally, the Commercial and Industrial Energy Storage Market was about USD 15 billion in 2023. In the UK, there is a robust pipeline, with over 70 GWh of approved battery energy storage system (BESS) projects expected to connect to the transmission network by the end of 2030.
For National Grid plc's gas network business, hydrogen and other alternative fuels present a clear, long-term substitution risk, especially given their own decarbonization goals. National Grid plc has a stated plan to transition its New York and Massachusetts gas networks to use renewable natural gas (RNG) and hydrogen by 2050 or sooner. This commitment to replace fossil fuel gas is a direct acknowledgment of the substitution threat in that segment.
Here's a quick look at some of the scale of these substitution and mitigation factors:
| Metric Category | Specific Figure/Target | Context/Year |
| Distributed Generation Projection (UK) | 80 GW to 140 GW | Distribution-connected generation by 2050 |
| US Solar Generation | 303 TWh | Total generation in 2024 |
| UK Domestic Electricity Reduction | 31% | Median consumption lower vs. 2005 (as of 2023) |
| Flexibility Cost Savings Potential | £6-£10 billion per year | Total system cost reduction up to 2050 |
| UK C&I Battery Market Size | USD 443.9 Million | Market size in 2025 |
| UK Approved BESS Pipeline | Over 70 GWh | Due to connect to transmission by end of 2030 |
The company is actively investing to manage this, with a record capital investment of almost £10 billion in the fiscal year ending March 2025. They are also deploying technologies like optimizing their LV Monitoring Rollout, cutting the planned deployment from 15,500 monitors to 11,000 while maintaining visibility.
National Grid plc (NGG) - Porter's Five Forces: Threat of new entrants
The threat of new entrants for National Grid plc in the core transmission and distribution space is defintely extremely low. You are looking at an incumbent position built on assets that require staggering sums of capital to replicate. For the fiscal year ended March 31, 2025, National Grid plc reported a record capital investment of almost £10 billion, which was 20% higher than the prior year. This is just the first year of a much larger commitment.
To give you a clearer picture of the scale, National Grid plc has outlined a cumulative capital investment plan of around £60 billion across its UK and US energy networks over the five-year period through FY2029. This massive, sustained spending creates an almost insurmountable barrier to entry for any potential competitor looking to build a parallel, large-scale network.
| Investment Metric | Amount (FY2025 or Period) | Context/Period |
| Record Capital Investment (FY2025) | Almost £10 billion | Year ended March 31, 2025 |
| Five-Year Investment Plan | Around £60 billion | FY2025 through FY2029 |
| Half-Year Investment (H1 FY2026) | £5.05 billion | Half-year to September 30, 2025 |
| UK Electricity Transmission Planned Investment | Around £23 billion | Over five years to FY2029 |
| NGV Committed Capex (5-Year) | Around £1 billion | Over five years to 2028/29 |
Beyond the sheer financial muscle required, the regulatory environment acts as a significant gatekeeper. The core transmission and distribution activities are heavily regulated by bodies like Ofgem. For instance, Ofgem gave provisional approval to an initial investment programme of £24.2bn for the RIIO-3 period (2026/27 to 2030/31), with a wider estimated programme of around £80bn. National Grid plc itself submitted a £35 billion RIIO-T3 business plan. Operating within these established, complex regulatory frameworks, which dictate returns and operational standards, is a near-impassable hurdle for a new player to clear.
New entrants are therefore largely confined to smaller, less regulated segments of the energy landscape. The scope for competition is limited to areas where the massive, integrated network is not the primary asset. These opportunities exist in:
- Non-wires alternatives (NWA) deployment.
- Small-scale, localized microgrids development.
- Specific ancillary services outside the core regulated monopoly.
The complexity of integrating any new, large-scale network with the existing, highly interconnected infrastructure is a major deterrent. The sheer technical challenge, coupled with the need to secure rights-of-way and manage interfaces with the incumbent system operator (now NESO for Great Britain electricity transmission), means that the risk and lead time for a new entrant to achieve meaningful scale are prohibitive. National Grid plc is securing its future delivery mechanisms, with supply chain and delivery mechanisms now secured for more than three-quarters of its £60 billion investment plan.
Disclaimer
All information, articles, and product details provided on this website are for general informational and educational purposes only. We do not claim any ownership over, nor do we intend to infringe upon, any trademarks, copyrights, logos, brand names, or other intellectual property mentioned or depicted on this site. Such intellectual property remains the property of its respective owners, and any references here are made solely for identification or informational purposes, without implying any affiliation, endorsement, or partnership.
We make no representations or warranties, express or implied, regarding the accuracy, completeness, or suitability of any content or products presented. Nothing on this website should be construed as legal, tax, investment, financial, medical, or other professional advice. In addition, no part of this site—including articles or product references—constitutes a solicitation, recommendation, endorsement, advertisement, or offer to buy or sell any securities, franchises, or other financial instruments, particularly in jurisdictions where such activity would be unlawful.
All content is of a general nature and may not address the specific circumstances of any individual or entity. It is not a substitute for professional advice or services. Any actions you take based on the information provided here are strictly at your own risk. You accept full responsibility for any decisions or outcomes arising from your use of this website and agree to release us from any liability in connection with your use of, or reliance upon, the content or products found herein.