
|
National HealthCare Corporation (NHC) DCF Valuation |
Fully Editable: Tailor To Your Needs In Excel Or Sheets
Professional Design: Trusted, Industry-Standard Templates
Investor-Approved Valuation Models
MAC/PC Compatible, Fully Unlocked
No Expertise Is Needed; Easy To Follow
National HealthCare Corporation (NHC) Bundle
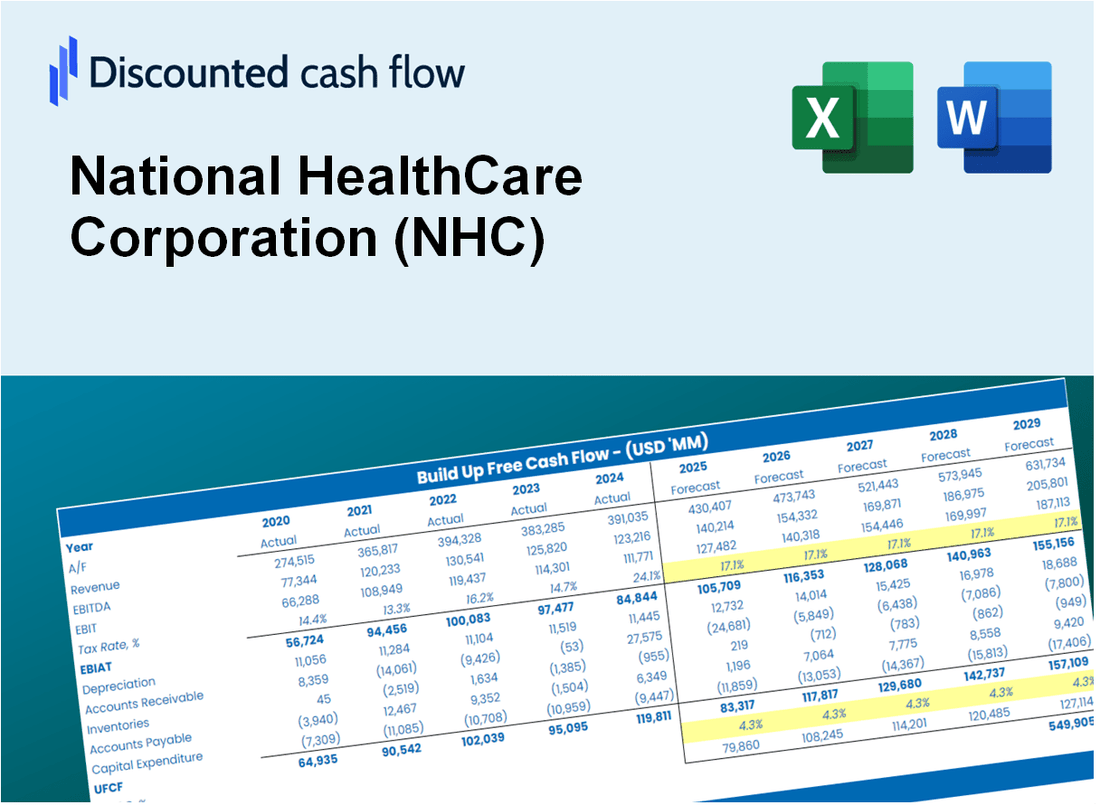
Gain mastery over your National HealthCare Corporation (NHC) valuation analysis with our state-of-the-art DCF Calculator! Preloaded with real (NHC) data, this Excel template empowers you to adjust forecasts and assumptions, enabling you to calculate the intrinsic value of National HealthCare Corporation (NHC) with accuracy.
Discounted Cash Flow (DCF) - (USD MM)
| Year | AY1 2020 |
AY2 2021 |
AY3 2022 |
AY4 2023 |
AY5 2024 |
FY1 2025 |
FY2 2026 |
FY3 2027 |
FY4 2028 |
FY5 2029 |
|---|---|---|---|---|---|---|---|---|---|---|
| Revenue | 980.7 | 1,010.9 | 1,074.3 | 1,141.5 | 1,297.9 | 1,393.0 | 1,495.1 | 1,604.7 | 1,722.2 | 1,848.4 |
| Revenue Growth, % | 0 | 3.08 | 6.27 | 6.26 | 13.7 | 7.33 | 7.33 | 7.33 | 7.33 | 7.33 |
| EBITDA | 95.8 | 191.6 | 68.3 | 131.1 | 182.5 | 168.9 | 181.3 | 194.6 | 208.8 | 224.1 |
| EBITDA, % | 9.77 | 18.95 | 6.36 | 11.48 | 14.06 | 12.12 | 12.12 | 12.12 | 12.12 | 12.12 |
| Depreciation | 42.0 | 40.7 | 40.5 | 42.0 | 42.0 | 52.9 | 56.8 | 61.0 | 65.4 | 70.2 |
| Depreciation, % | 4.28 | 4.02 | 3.77 | 3.68 | 3.23 | 3.8 | 3.8 | 3.8 | 3.8 | 3.8 |
| EBIT | 53.8 | 150.9 | 27.8 | 89.1 | 140.5 | 116.0 | 124.5 | 133.6 | 143.4 | 153.9 |
| EBIT, % | 5.49 | 14.92 | 2.59 | 7.8 | 10.83 | 8.33 | 8.33 | 8.33 | 8.33 | 8.33 |
| Total Cash | 323.4 | 256.0 | 182.6 | 223.6 | 216.2 | 310.8 | 333.6 | 358.0 | 384.2 | 412.4 |
| Total Cash, percent | .0 | .0 | .0 | .0 | .0 | .0 | .0 | .0 | .0 | .0 |
| Account Receivables | 89.7 | 96.6 | 100.3 | 109.0 | 135.8 | 133.9 | 143.7 | 154.2 | 165.5 | 177.6 |
| Account Receivables, % | 9.14 | 9.55 | 9.34 | 9.55 | 10.47 | 9.61 | 9.61 | 9.61 | 9.61 | 9.61 |
| Inventories | 8.8 | 8.6 | 7.1 | 7.4 | 9.0 | 10.4 | 11.2 | 12.0 | 12.9 | 13.9 |
| Inventories, % | 0.89537 | 0.84891 | 0.65979 | 0.64702 | 0.69641 | 0.7495 | 0.7495 | 0.7495 | 0.7495 | 0.7495 |
| Accounts Payable | 21.1 | 22.5 | 17.0 | 19.2 | 25.5 | 26.7 | 28.7 | 30.8 | 33.1 | 35.5 |
| Accounts Payable, % | 2.15 | 2.22 | 1.58 | 1.68 | 1.96 | 1.92 | 1.92 | 1.92 | 1.92 | 1.92 |
| Capital Expenditure | -21.9 | -39.4 | -30.2 | -27.9 | -27.6 | -37.6 | -40.4 | -43.4 | -46.5 | -49.9 |
| Capital Expenditure, % | -2.23 | -3.9 | -2.81 | -2.44 | -2.13 | -2.7 | -2.7 | -2.7 | -2.7 | -2.7 |
| Tax Rate, % | 25.28 | 25.28 | 25.28 | 25.28 | 25.28 | 25.28 | 25.28 | 25.28 | 25.28 | 25.28 |
| EBITAT | 43.0 | 139.4 | 22.9 | 67.0 | 105.0 | 93.9 | 100.7 | 108.1 | 116.1 | 124.6 |
| Depreciation | ||||||||||
| Changes in Account Receivables | ||||||||||
| Changes in Inventories | ||||||||||
| Changes in Accounts Payable | ||||||||||
| Capital Expenditure | ||||||||||
| UFCF | -14.2 | 135.3 | 25.5 | 74.4 | 97.3 | 111.0 | 108.5 | 116.5 | 125.0 | 134.2 |
| WACC, % | 6.15 | 6.19 | 6.16 | 6.13 | 6.13 | 6.15 | 6.15 | 6.15 | 6.15 | 6.15 |
| PV UFCF | ||||||||||
| SUM PV UFCF | 496.3 | |||||||||
| Long Term Growth Rate, % | 0.50 | |||||||||
| Free cash flow (T + 1) | 135 | |||||||||
| Terminal Value | 2,386 | |||||||||
| Present Terminal Value | 1,771 | |||||||||
| Enterprise Value | 2,267 | |||||||||
| Net Debt | 139 | |||||||||
| Equity Value | 2,128 | |||||||||
| Diluted Shares Outstanding, MM | 16 | |||||||||
| Equity Value Per Share | 136.44 |
What You Will Receive
- Comprehensive Financial Model: NHC’s actual data facilitates accurate DCF valuation.
- Complete Forecasting Flexibility: Modify revenue growth, profit margins, WACC, and other essential parameters.
- Real-Time Calculations: Automatic updates provide immediate feedback as you adjust inputs.
- Professional-Grade Template: A polished Excel file crafted for high-quality valuation presentations.
- Adaptable and Reusable: Designed for versatility, enabling repeated application for in-depth forecasts.
Key Features
- Authentic NHC Financials: Gain access to precise pre-loaded historical data and future forecasts.
- Adjustable Forecast Parameters: Modify highlighted cells for variables such as WACC, growth rates, and profit margins.
- Real-time Calculations: Instant updates to DCF, Net Present Value (NPV), and cash flow assessments.
- Interactive Dashboard: User-friendly charts and summaries for an intuitive visualization of your valuation findings.
- Designed for All Skill Levels: A straightforward, user-centric layout tailored for investors, CFOs, and consultants alike.
How It Works
- Download: Obtain the pre-built Excel file containing National HealthCare Corporation’s (NHC) financial data.
- Customize: Modify projections, such as occupancy rates, revenue per patient, and cost structures.
- Update Automatically: The intrinsic value and NPV calculations refresh in real-time.
- Test Scenarios: Generate various forecasts and evaluate results instantly.
- Make Decisions: Leverage the valuation insights to inform your investment choices.
Why Choose This Calculator for National HealthCare Corporation (NHC)?
- Accurate Data: Real National HealthCare Corporation financials provide trustworthy valuation outcomes.
- Customizable: Modify essential parameters such as growth rates, WACC, and tax rates to align with your forecasts.
- Time-Saving: Built-in calculations save you from starting from square one.
- Professional-Grade Tool: Tailored for investors, analysts, and consultants in the healthcare sector.
- User-Friendly: Simple layout and clear, step-by-step guidance make it accessible for all users.
Who Should Use This Product?
- Investors: Accurately assess National HealthCare Corporation’s (NHC) fair value prior to making investment choices.
- CFOs: Utilize a professional-grade DCF model for comprehensive financial reporting and analysis.
- Consultants: Easily customize the template for valuation reports tailored to clients.
- Entrepreneurs: Acquire insights into financial modeling practices employed by leading healthcare corporations.
- Educators: Implement it as a teaching resource to illustrate valuation techniques.
What the Template Contains
- Pre-Filled DCF Model: National HealthCare Corporation's (NHC) financial data preloaded for immediate use.
- WACC Calculator: Detailed calculations for Weighted Average Cost of Capital.
- Financial Ratios: Evaluate NHC's profitability, leverage, and efficiency.
- Editable Inputs: Change assumptions such as growth, margins, and CAPEX to fit your scenarios.
- Financial Statements: Annual and quarterly reports to support detailed analysis.
- Interactive Dashboard: Easily visualize key valuation metrics and results.
Disclaimer
All information, articles, and product details provided on this website are for general informational and educational purposes only. We do not claim any ownership over, nor do we intend to infringe upon, any trademarks, copyrights, logos, brand names, or other intellectual property mentioned or depicted on this site. Such intellectual property remains the property of its respective owners, and any references here are made solely for identification or informational purposes, without implying any affiliation, endorsement, or partnership.
We make no representations or warranties, express or implied, regarding the accuracy, completeness, or suitability of any content or products presented. Nothing on this website should be construed as legal, tax, investment, financial, medical, or other professional advice. In addition, no part of this site—including articles or product references—constitutes a solicitation, recommendation, endorsement, advertisement, or offer to buy or sell any securities, franchises, or other financial instruments, particularly in jurisdictions where such activity would be unlawful.
All content is of a general nature and may not address the specific circumstances of any individual or entity. It is not a substitute for professional advice or services. Any actions you take based on the information provided here are strictly at your own risk. You accept full responsibility for any decisions or outcomes arising from your use of this website and agree to release us from any liability in connection with your use of, or reliance upon, the content or products found herein.