
|
Annaly Capital Management, Inc. (NLY) DCF Valuation |
Fully Editable: Tailor To Your Needs In Excel Or Sheets
Professional Design: Trusted, Industry-Standard Templates
Investor-Approved Valuation Models
MAC/PC Compatible, Fully Unlocked
No Expertise Is Needed; Easy To Follow
Annaly Capital Management, Inc. (NLY) Bundle
Gain insight into your Annaly Capital Management, Inc. (NLY) valuation analysis with our sophisticated DCF Calculator! Preloaded with real (NLY) data, this Excel template enables you to adjust forecasts and assumptions to accurately determine the intrinsic value of Annaly Capital Management, Inc.
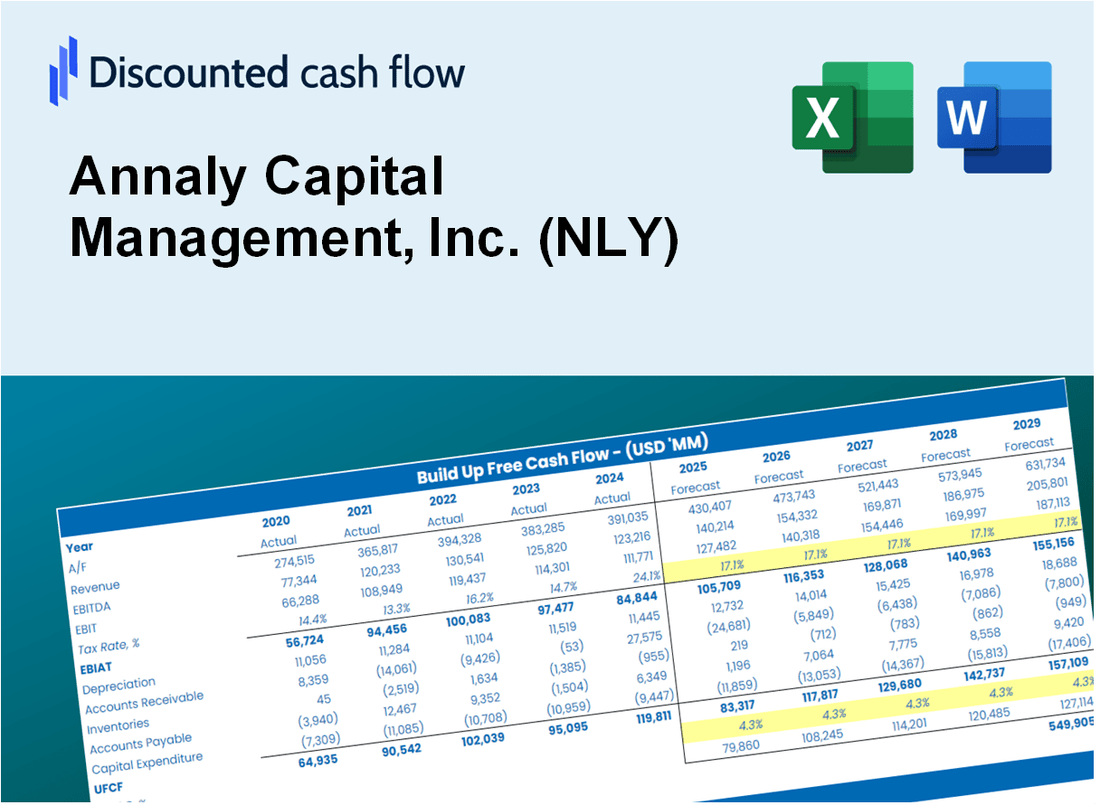
Discounted Cash Flow (DCF) - (USD MM)
| Year | AY1 2020 |
AY2 2021 |
AY3 2022 |
AY4 2023 |
AY5 2024 |
FY1 2025 |
FY2 2026 |
FY3 2027 |
FY4 2028 |
FY5 2029 |
|---|---|---|---|---|---|---|---|---|---|---|
| Revenue | 1,484.5 | 751.4 | 4,150.0 | 5,607.9 | 1,247.9 | 1,272.8 | 1,298.3 | 1,324.2 | 1,350.7 | 1,377.7 |
| Revenue Growth, % | 0 | -49.38 | 452.3 | 35.13 | -77.75 | 2 | 2 | 2 | 2 | 2 |
| EBITDA | 3.6 | 2,953.4 | 3,142.5 | 2,268.7 | 5,649.6 | 805.5 | 821.6 | 838.0 | 854.8 | 871.9 |
| EBITDA, % | 0.24365 | 393.05 | 75.72 | 40.46 | 452.75 | 63.28 | 63.28 | 63.28 | 63.28 | 63.28 |
| Depreciation | 22.7 | 24.6 | 20.5 | 24.8 | 30.4 | 20.8 | 21.2 | 21.7 | 22.1 | 22.5 |
| Depreciation, % | 1.53 | 3.28 | 0.49412 | 0.44234 | 2.43 | 1.64 | 1.64 | 1.64 | 1.64 | 1.64 |
| EBIT | -19.1 | 2,928.8 | 3,122.0 | 2,243.9 | 5,619.3 | 799.2 | 815.2 | 831.5 | 848.1 | 865.1 |
| EBIT, % | -1.29 | 389.77 | 75.23 | 40.01 | 450.31 | 62.79 | 62.79 | 62.79 | 62.79 | 62.79 |
| Total Cash | 1,243.7 | 1,342.1 | 1,576.7 | 1,412.1 | 510.5 | 732.8 | 747.5 | 762.4 | 777.6 | 793.2 |
| Total Cash, percent | .0 | .0 | .0 | .0 | .0 | .0 | .0 | .0 | .0 | .0 |
| Account Receivables | 284.0 | 237.6 | 1,212.4 | 3,932.9 | 3,270.5 | 636.7 | 649.4 | 662.4 | 675.6 | 689.1 |
| Account Receivables, % | 19.13 | 31.63 | 29.21 | 70.13 | 262.09 | 50.02 | 50.02 | 50.02 | 50.02 | 50.02 |
| Inventories | .0 | .0 | .0 | .0 | .0 | .0 | .0 | .0 | .0 | .0 |
| Inventories, % | 0 | 0 | 0 | 0 | 0 | 0 | 0 | 0 | 0 | 0 |
| Accounts Payable | 191.1 | 91.2 | 325.3 | 287.9 | 268.3 | 151.4 | 154.5 | 157.5 | 160.7 | 163.9 |
| Accounts Payable, % | 12.87 | 12.13 | 7.84 | 5.13 | 21.5 | 11.9 | 11.9 | 11.9 | 11.9 | 11.9 |
| Capital Expenditure | .0 | -538.1 | -1,014.3 | -396.8 | -863.1 | -438.6 | -447.4 | -456.3 | -465.5 | -474.8 |
| Capital Expenditure, % | 0 | -71.62 | -24.44 | -7.08 | -69.17 | -34.46 | -34.46 | -34.46 | -34.46 | -34.46 |
| Tax Rate, % | 2.45 | 2.45 | 2.45 | 2.45 | 2.45 | 2.45 | 2.45 | 2.45 | 2.45 | 2.45 |
| EBITAT | -18.5 | 2,915.3 | 3,039.8 | 2,305.9 | 5,481.8 | 785.7 | 801.4 | 817.4 | 833.7 | 850.4 |
| Depreciation | ||||||||||
| Changes in Account Receivables | ||||||||||
| Changes in Inventories | ||||||||||
| Changes in Accounts Payable | ||||||||||
| Capital Expenditure | ||||||||||
| UFCF | -88.7 | 2,348.2 | 1,305.4 | -824.0 | 5,291.9 | 2,884.8 | 365.5 | 372.8 | 380.3 | 387.9 |
| WACC, % | 5.53 | 5.64 | 5.54 | 5.66 | 5.55 | 5.59 | 5.59 | 5.59 | 5.59 | 5.59 |
| PV UFCF | ||||||||||
| SUM PV UFCF | 3,978.3 | |||||||||
| Long Term Growth Rate, % | 2.00 | |||||||||
| Free cash flow (T + 1) | 396 | |||||||||
| Terminal Value | 11,034 | |||||||||
| Present Terminal Value | 8,408 | |||||||||
| Enterprise Value | 12,386 | |||||||||
| Net Debt | 89,408 | |||||||||
| Equity Value | -77,022 | |||||||||
| Diluted Shares Outstanding, MM | 523 | |||||||||
| Equity Value Per Share | -147.34 |
What You Will Receive
- Customizable Excel Template: A fully adaptable Excel-based DCF Calculator featuring pre-filled real NLY financials.
- Actual Data: Historical figures and forward-looking projections (highlighted in the yellow cells).
- Forecast Customization: Modify assumptions such as revenue growth, EBITDA %, and WACC.
- Instant Calculations: Quickly observe how your inputs affect Annaly's valuation.
- Professional Resource: Designed for investors, CFOs, consultants, and financial analysts.
- User-Centric Layout: Organized for clarity and simplicity, complete with step-by-step guidance.
Key Features
- Comprehensive Data: Annaly Capital Management's historical financial reports and pre-filled projections.
- Customizable Parameters: Adjust WACC, tax rates, revenue growth, and EBITDA margins as needed.
- Real-Time Insights: Instantly view Annaly's intrinsic value recalculating with each change.
- Intuitive Visualizations: Dashboard graphs showcase valuation outcomes and essential metrics.
- Designed for Precision: A professional-grade tool for analysts, investors, and finance professionals.
How It Works
- Step 1: Download the Excel file for Annaly Capital Management, Inc. (NLY).
- Step 2: Review the pre-filled financial data and forecasts for Annaly Capital Management.
- Step 3: Adjust key inputs such as dividend yield, leverage ratios, and interest rates (highlighted cells).
- Step 4: Observe the DCF model update in real-time as you modify your assumptions.
- Step 5: Evaluate the outputs and apply the findings to your investment strategies.
Why Choose This Calculator for Annaly Capital Management, Inc. (NLY)?
- Accurate Data: Real Annaly financials provide dependable valuation outcomes.
- Customizable: Tailor essential parameters such as growth rates, WACC, and tax rates to align with your forecasts.
- Time-Saving: Built-in calculations save you from starting from scratch.
- Professional-Grade Tool: Crafted for investors, analysts, and consultants in the finance sector.
- User-Friendly: Simple design and clear instructions make it accessible for all users.
Who Should Use This Product?
- Real Estate Investors: Develop comprehensive and dependable valuation models for analyzing real estate investment trusts (REITs).
- Corporate Finance Teams: Evaluate valuation scenarios to inform strategic decisions within the organization.
- Consultants and Advisors: Deliver precise valuation insights for Annaly Capital Management, Inc. (NLY) to clients.
- Students and Educators: Utilize actual market data to enhance learning and practice in financial modeling.
- Finance Enthusiasts: Gain insights into how mortgage REITs like Annaly Capital Management, Inc. (NLY) are valued in the financial markets.
What the Template Contains
- Comprehensive DCF Model: Editable template featuring detailed valuation calculations tailored for Annaly Capital Management, Inc. (NLY).
- Real-World Data: Historical and projected financials for Annaly Capital Management, Inc. (NLY) preloaded for in-depth analysis.
- Customizable Parameters: Modify WACC, growth rates, and tax assumptions to explore various scenarios.
- Financial Statements: Complete annual and quarterly breakdowns to provide deeper insights into Annaly Capital Management, Inc. (NLY).
- Key Ratios: Integrated analysis covering profitability, efficiency, and leverage metrics.
- Dashboard with Visual Outputs: Intuitive charts and tables for clear, actionable results specific to Annaly Capital Management, Inc. (NLY).
Disclaimer
All information, articles, and product details provided on this website are for general informational and educational purposes only. We do not claim any ownership over, nor do we intend to infringe upon, any trademarks, copyrights, logos, brand names, or other intellectual property mentioned or depicted on this site. Such intellectual property remains the property of its respective owners, and any references here are made solely for identification or informational purposes, without implying any affiliation, endorsement, or partnership.
We make no representations or warranties, express or implied, regarding the accuracy, completeness, or suitability of any content or products presented. Nothing on this website should be construed as legal, tax, investment, financial, medical, or other professional advice. In addition, no part of this site—including articles or product references—constitutes a solicitation, recommendation, endorsement, advertisement, or offer to buy or sell any securities, franchises, or other financial instruments, particularly in jurisdictions where such activity would be unlawful.
All content is of a general nature and may not address the specific circumstances of any individual or entity. It is not a substitute for professional advice or services. Any actions you take based on the information provided here are strictly at your own risk. You accept full responsibility for any decisions or outcomes arising from your use of this website and agree to release us from any liability in connection with your use of, or reliance upon, the content or products found herein.