
|
Sunnova Energy International Inc. (NOVA): PESTLE Analysis [Nov-2025 Updated] |
Fully Editable: Tailor To Your Needs In Excel Or Sheets
Professional Design: Trusted, Industry-Standard Templates
Investor-Approved Valuation Models
MAC/PC Compatible, Fully Unlocked
No Expertise Is Needed; Easy To Follow
Sunnova Energy International Inc. (NOVA) Bundle
You're looking into Sunnova Energy International Inc. (NOVA), and let's be honest, the story is complex: a Chapter 11 bankruptcy filing in June 2025 and a substantial funded debt of around $8.9 billion overshadow a massive market opportunity. The near-term is all about navigating high interest rates and state-level net metering policy changes, but the underlying consumer demand for energy independence-with the customer base surpassing 400,000 and the rising 34% battery attachment rate-show the adaptive energy services model still has serious long-term pull. We need to map these political, economic, and technological forces right now to see where the real risks and opportunities lie, so let's dig into the 2025 PESTLE breakdown.
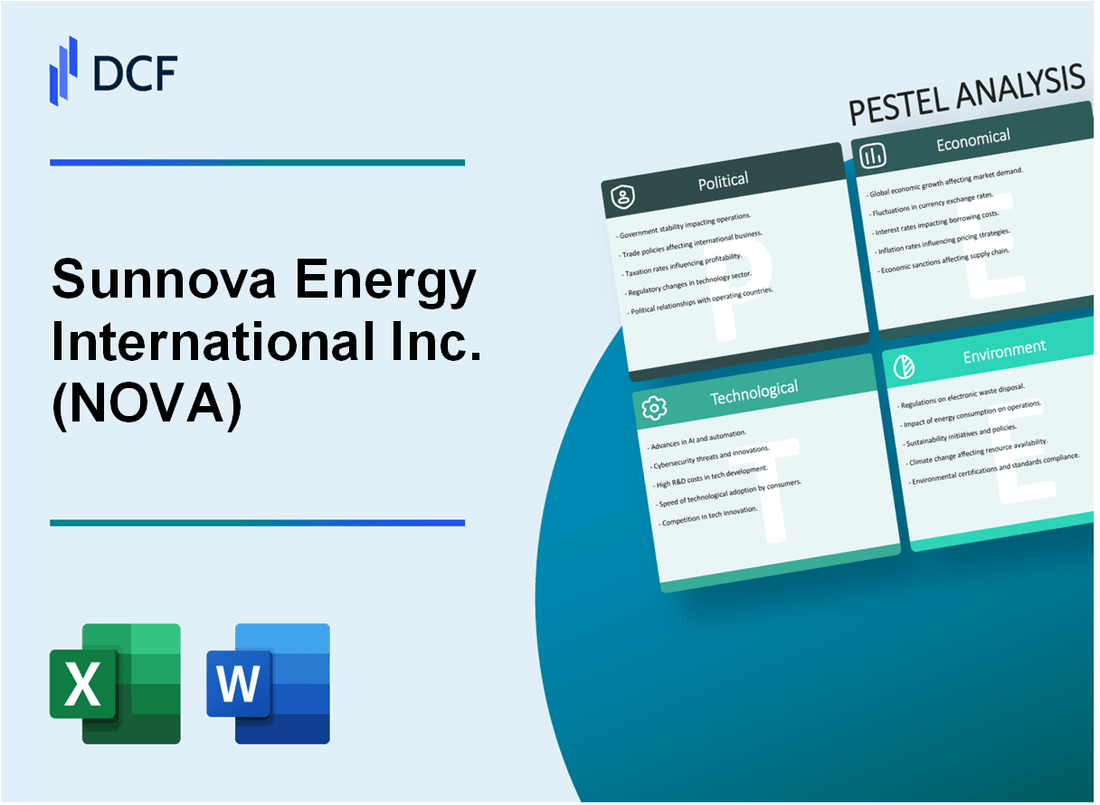
Sunnova Energy International Inc. (NOVA) - PESTLE Analysis: Political factors
Chapter 11 Bankruptcy Filing in June 2025 Facilitates a Sale Process
The most immediate and impactful political-economic event for Sunnova Energy International Inc. in 2025 was its voluntary filing for Chapter 11 bankruptcy relief on June 8, 2025, in the U.S. Bankruptcy Court for the Southern District of Texas. This action was a direct political-legal maneuver to facilitate a value-maximizing sale process for the company's assets and operations.
The court-supervised sale process, which concluded in September 2025, saw Solaris Assets LLC and its affiliates acquire substantially all of Sunnova's assets. This transaction included the residential solar servicing platform and the solar generation and storage portfolio. The total deal was previously valued by Law360 at $118 million, with Solaris providing a credit bid of the debtor-in-possession (DIP) financing plus $25 million in cash consideration. This legal framework provided a clean break and a path for the core business to continue under new ownership.
The company secured interim court approval for $90 million in DIP financing from corporate bondholders to fund operations during the restructuring. Separately, the New Homes business unit was sold to Lennar Homes, LLC for approximately $16.0 million.
Policy Uncertainty Surrounds the Fate of Technology-Neutral Tax Credits Under the Inflation Reduction Act
For any solar company, federal tax policy is the lifeblood of project finance. The Inflation Reduction Act (IRA) created a major shift in 2025 with the introduction of the technology-neutral clean electricity tax credits, Section 45Y (Production Tax Credit) and Section 48E (Investment Tax Credit), which replaced the old credits for new projects beginning construction.
The U.S. Treasury and IRS finalized guidance in January 2025, confirming solar is a qualifying zero-emissions technology. The core political risk now is the long-term stability of these credits beyond 2025, especially given the impending changes in the political administration and Congress composition. A shift in political power could lead to attempts to repeal or significantly alter the IRA's provisions, which would defintely re-introduce policy uncertainty and complicate long-term capital planning. The new 48E Investment Tax Credit offers a base rate of 6 percent but jumps to 30 percent if prevailing wage and apprenticeship requirements are met, making compliance a political-labor consideration.
Federal Government Support Includes a U.S. Department of Energy (DOE) Loan Guarantee Arrangement
Federal government support, once a significant boon, became a source of instability in 2025. Sunnova had a commitment from the U.S. Department of Energy (DOE) for a partial loan guarantee under Project Hestia, initially valued at $3.0 billion. This was meant to support solar loans, particularly for low-income homeowners, and was touted as the largest U.S. government commitment to solar power at the time.
However, in a significant political and financial blow, the DOE effectively terminated the remaining capacity of this guarantee in May 2025. The maximum aggregate amount of partial guarantees was reduced from $3.0 billion to $371.6 million, which is the exact amount already utilized by Sunnova for two existing solar loan securitizations. The DOE 'de-obligated' the remaining $2.92 billion of the guarantee. This action, occurring just before the Chapter 11 filing, signaled a withdrawal of critical federal support due to the company's financial distress and a shift in its business model away from the specific solar loan product the guarantee was designed to support.
| DOE Project Hestia Loan Guarantee Status (May 2025) | Amount | Impact on Sunnova |
|---|---|---|
| Original Maximum Partial Guarantee | $3.0 billion | Initial strong signal of federal support for Project Hestia. |
| Reduced Maximum Partial Guarantee (Utilized Amount) | $371.6 million | The amount already used for existing securitizations (e.g., Hestia I and II). |
| Remaining Guarantee De-Obligated/Cancelled | $2.92 billion | Loss of future, low-cost federal backstop financing capacity. |
State-Level Net Metering (NEM) Policy Changes Directly Impact the Profitability of New Installations
State-level regulatory changes, particularly around Net Energy Metering (NEM), represent a decentralized but persistent political risk that directly hits project economics. NEM policies determine the compensation solar customers receive for exporting excess power to the grid.
The clear trend across 2025 is a move away from the traditional 1:1 retail rate compensation toward net billing or successor tariffs, which reduces the financial return for new solar customers. This directly impacts Sunnova's ability to structure attractive Power Purchase Agreements (PPAs) and leases in key markets. For example, the shift to a net billing tariff in California (NEM 3.0) significantly reduced the export credit rate, making battery storage a near-mandatory component to maintain customer savings.
Other states are following suit or proposing similar changes:
- Virginia's Dominion Energy proposed a NEM 2.0 successor program using net billing with 30-minute intervals.
- Illinois reduced the net metering benefit for all new solar customers starting January 1, 2025.
- Nevada Power and Sierra Power filed new net metering successor tariffs with state regulators in Q1 2025.
This political environment forces the company to constantly redesign its offerings, shifting focus to solar-plus-storage solutions to mitigate the impact of lower export compensation. It's a game of perpetual regulatory adaptation.
Sunnova Energy International Inc. (NOVA) - PESTLE Analysis: Economic factors
Company stated 'substantial doubt' about continuing as a going concern in March 2025
You need to know the cold, hard truth: Sunnova Energy International Inc. (NOVA) is facing an existential economic crisis. In its March 3, 2025, filing for the full year 2024 results, the company disclosed that 'substantial doubt exists regarding our ability to continue as a going concern for a period of at least one year.' This isn't corporate hedging; it's a red flag that their unrestricted cash flow and existing financing are simply not enough to cover their obligations and fund operations over the next 12 months. For a capital-intensive business, that cash generation gap is a massive problem.
The core issue is a rapid cash burn and a negative cash flow position entering 2025, which is why the stock plummeted by nearly 60% on the news. The market is defintely pricing in the risk of a financial restructuring.
High interest rates placed significant strain on the company's capital-intensive financing model
The residential solar business, especially the third-party ownership (TPO) model Sunnova favors, is a capital-intensive game. You have to borrow a lot of money upfront to install systems, and then you wait years to collect payments. The stubbornly high interest rate environment in 2024 and 2025 has completely broken the math on this model.
Here's the quick math: Rising rates made debt borrowing more expensive, which directly increased Sunnova's interest expense to $491 million in the 2024 fiscal year, up sharply from $372 million in 2023. That's a massive drag on profitability. To illustrate the cost of capital strain, Sunnova had to secure a new $185 million term loan at an eye-watering interest rate of 15%. That's the price of liquidity when your balance sheet is under pressure.
Total funded debt is substantial, around $8.9 billion, with a debt-to-equity ratio near 4.6x
The company's leverage profile is alarming. As of early 2025, Sunnova was drowning in debt, which is the primary economic factor driving its distress.
The total funded debt load is approximately $8.5 billion as of May 2025. When you compare this to the equity base, the resulting Debt-to-Equity (D/E) ratio is a staggering 4.62x as of December 2024. This level of financial leverage is extremely high and signals that the company is overwhelmingly financed by debt, making it hyper-sensitive to any changes in interest rates or cash flow.
This high leverage is what makes the business model so fragile right now.
| Key Financial Metric (As of Dec. 31, 2024) | Value | Context |
|---|---|---|
| Total Funded Debt (Approx.) | $8.5 billion | Represents the massive capital required for the TPO solar model. |
| Debt-to-Equity Ratio | 4.62x | Indicates an extreme reliance on debt financing. |
| Annual Interest Expense (FY 2024) | $491 million | A direct measure of the high interest rate environment's impact, up from $372 million in 2023. |
| Unrestricted Cash (As of Dec. 31, 2024) | $211.2 million | A critical, low liquidity buffer against $8.5 billion in debt. |
Cost-saving initiatives in early 2025 aimed for roughly $70 million in annual cash savings, including a workforce reduction of over 15%
In response to the severe economic headwinds, Sunnova initiated aggressive cost-saving measures in February 2025. The goal was to streamline operations and prioritize cash generation, focusing on their higher-margin Third-Party Ownership (TPO) products.
The company targeted total estimated annual cash savings of approximately $70 million. A significant portion of this was achieved through painful but necessary operational cuts:
- Reducing the workforce by more than 15%, cutting nearly 300 positions.
- Optimizing overhead costs, with the workforce reduction contributing about $35 million to the total cash savings goal.
- Shifting dealer payment terms to better align with the company's own funding sources.
These are emergency actions to conserve cash and buy time, but they don't resolve the underlying structural problem of the high-cost debt and the need for continuous, massive capital injections.
Sunnova Energy International Inc. (NOVA) - PESTLE Analysis: Social factors
The 'Adaptive Energy Services' Model Appeals to Homeowners
The core of Sunnova Energy International Inc.'s social appeal lies in its shift to an 'adaptive energy services' model, which is essentially energy-as-a-service (EaaS) evolved for resilience. This approach directly addresses the consumer desire for energy independence and lower upfront costs, a major social trend in the US. The model uses a Third-Party Ownership (TPO) structure-leases or Power Purchase Agreements (PPAs)-that lets homeowners install a solar-plus-storage system with minimal to no initial investment. This removes the major financial barrier for a wider demographic.
The company's proprietary Sunnova Sentient™ technology platform aggregates customer systems into a Virtual Power Plant (VPP), which is a huge social benefit. This VPP allows customers to earn financial benefits by dispatching their excess battery power back to the grid during peak demand, like in Texas.
It's a win-win: customers get reliable backup power, and the grid gets flexible support. That's a powerful social narrative, defintely.
Strong Consumer Adoption and Growth in Customer Base
Consumer adoption of Sunnova's residential solar-plus-storage model has been strong, driven by the social desire for resilience against increasing grid outages and rising utility rates. The company surpassed 400,000 customers in 2023. By the end of the first quarter of 2024 (Q1 2024), the total customer count had reached 438,500. This growth demonstrates how quickly the market is embracing the EaaS concept.
Here's the quick math on recent growth:
| Metric | Value (as of Dec 31, 2023) | Value (as of Mar 31, 2024) |
|---|---|---|
| Total Customers (Cumulative) | >400,000 | 438,500 |
| Customer Additions (Q1 2024) | N/A | 27,000 |
| 2024 Customer Additions Target | N/A | 140,000 - 150,000 (Revised) |
Growing Consumer Demand for Home Battery Storage
The social factor of grid resilience is a major tailwind for Sunnova, especially in areas prone to severe weather events like Hurricanes Milton and Helene in 2024, where 98% of Sunnova systems remained intact. The growing consumer demand for home battery storage systems is directly linked to concerns over grid outages and the need for energy security.
This demand is clearly visible in the company's product mix:
- Battery attachment rates increased from 27% in 2023 to 34% for the full year 2024.
- Total energy storage under management reached 1,662 megawatt hours (MWh) as of December 31, 2024.
- Globally, the household energy storage market is projected to exceed $15 billion in 2025, growing at a Compound Annual Growth Rate (CAGR) surpassing 20% through 2030, showing massive market momentum.
Diversity Objectives and Employee Turnover
Sunnova has focused on diversity objectives and set a clear goal to reduce year-over-year voluntary employee turnover to 15% by year-end 2025. This target reflects a commitment to employee retention, a key social metric for any large organization. To be fair, they were already close, with voluntary turnover standing at 14.16% as of December 31, 2023.
However, the social climate within the company has been significantly impacted by cost-cutting measures in 2025. The company announced an initial workforce reduction of over 15% (nearly 300 positions) in February 2025. This was followed by a much larger layoff of 55% of the workforce (around 718 employees) in June 2025, which coincided with the company's Chapter 11 bankruptcy filing. This shift from targeted voluntary reduction to massive involuntary cuts highlights a major near-term risk to employee morale and external social perception, regardless of the initial retention goals.
The total number of employees decreased from 2,047 at the end of 2023 to 1,796 at the end of 2024, before the major 2025 layoffs. That's a 12% drop already.
Sunnova Energy International Inc. (NOVA) - PESTLE Analysis: Technological factors
Strategic partnership with OpenSolar in February 2025 integrated AI design technology into the dealer platform, improving sales efficiency.
You're looking for ways to cut sales friction, and honestly, Sunnova Energy International Inc. (NOVA) just took a major step by weaponizing Artificial Intelligence (AI) to do just that. In February 2025, Sunnova announced a strategic partnership with OpenSolar, integrating their AI-powered design tools directly into the Catalyst dealer platform, which is what Sunnova's national network of installers uses for sales and design.
This isn't about minor tweaks; it's a fundamental shift in speed. The AI-driven system automatically generates highly accurate solar system designs and proposals in seconds, a process that previously took a salesperson or a centralized design team up to 15 minutes at best. That's a huge time-saver for the dealer, which means faster proposals for you, the customer. Plus, the AI is defintely better at identifying complex rooftop obstacles like pipes and chimneys than a human might be, ensuring greater precision.
Here's the quick math on the efficiency gain:
- Manual Design Time: Up to 15 minutes per proposal.
- AI-Powered Design Time: Seconds per proposal.
Battery attachment rate increased to 34% in 2024, up from 27% in 2023, boosting system resilience and value.
The rise in battery attachment rate-the percentage of new solar installations that include a home battery storage system-is a clear technological trend that directly impacts Sunnova's business model and your home's resilience. For the full fiscal year 2024, Sunnova's battery attachment rate was 34%, a significant jump from 27% in 2023.
This increase is crucial because it drives higher revenue per system and shifts the customer relationship from a simple solar sale to a more comprehensive energy service. The trend is accelerating; in the third quarter of 2024 alone, the attachment rate for Power Purchase Agreement (PPA) and lease systems hit 40%, up from 33% in the same quarter in 2023. Higher battery inclusion means a more valuable asset for Sunnova and, for you, greater energy independence during grid outages.
The table below shows the clear upward trajectory:
| Metric | Full Year 2023 | Full Year 2024 | Q3 2024 (PPA/Lease) |
|---|---|---|---|
| Battery Attachment Rate | 27% | 34% | 40% |
Continued investment in Virtual Power Plants (VPPs) and grid services shifts the business to a more utility-interactive model.
Sunnova is actively moving toward becoming a utility-interactive company by developing Virtual Power Plants (VPPs)-a network of residential solar-plus-storage systems that can collectively feed power back to the grid during peak demand or emergencies. This technology is managed by Sunnova's proprietary software, Sunnova Sentient.
The company is expanding its VPP network across key states and territories like California, Texas, New York, and Puerto Rico. For example, Sunnova's customers already account for approximately 1 GWh of storage capacity across the network. In Puerto Rico, their 10-MWh VPP has already helped prevent five grid outages since its debut. This VPP strategy is central to their long-term growth and is supported by significant government backing, including a $3 billion conditional loan commitment from the U.S. Department of Energy (DOE) for 'Project Hestia,' which is expected to lead to up to $5 billion in loan originations for VPP-enabled systems in disadvantaged communities.
Focus on mandating domestic content for dealers to maximize the Investment Tax Credit (ITC) percentage.
The technology strategy is now tightly coupled with financial incentives from the Inflation Reduction Act (IRA). Sunnova is focusing on mandating domestic content in its systems to maximize the Investment Tax Credit (ITC), which is a key driver of project economics.
For projects starting construction in 2025, meeting the domestic content requirement means that 45% of the manufactured product costs must be U.S.-made, in addition to 100% of structural steel and iron. Successfully meeting this requirement allows the standard 30% ITC to increase by 10 percentage points to 40%. This is a huge competitive advantage. Sunnova has already been successful in capturing these adders, reporting an average ITC rate of 37%-38% in the third quarter of 2024, showing a clear, early lead in leveraging this technology-supply chain requirement.
Sunnova Energy International Inc. (NOVA) - PESTLE Analysis: Legal factors
The June 2025 Chapter 11 filing resulted in the delisting from the NYSE, with stock now trading OTC under NOVAQ.
You need to understand that the single biggest legal event in 2025 was Sunnova Energy International Inc.'s voluntary petition for Chapter 11 bankruptcy relief, filed on June 8, 2025, in the Southern District of Texas. The New York Stock Exchange (NYSE) immediately commenced delisting proceedings, and the stock was suspended from trading. This is a huge red flag for investors, signaling severe financial distress.
As a direct consequence, the common stock was delisted and began trading on the Over-The-Counter (OTC) markets under the new ticker symbol, NOVAQ, effective June 10, 2025. To manage operations during the restructuring, the company secured a $90 million debtor-in-possession (DIP) loan. This bankruptcy process, however, was structured to be 'bankruptcy remote' from its key financing vehicles, meaning the filing should not materially impact closed tax equity partnership affiliates or asset-backed securities (ABS) holders.
Failure to file the Q1 2025 Form 10-Q on time led to an NYSE compliance notice in May 2025.
The company's legal and financial compliance issues were evident even before the bankruptcy filing. Sunnova Energy received a notice from the NYSE on May 23, 2025, indicating non-compliance for failing to timely file its Quarterly Report on Form 10-Q for the quarter ended March 31, 2025. The company had until November 19, 2025, to submit the overdue report and regain compliance, a deadline that became moot with the June Chapter 11 filing.
This wasn't their only NYSE issue. Earlier, on April 1, 2025, the company received a separate notice for failing to maintain the required minimum average closing share price of at least $1.00 over a 30-day period. This dual failure to meet both financial reporting and minimum price standards signaled deep operational and capital market problems. Honestly, when your debt load is around $8.5 billion, management focus is defintely elsewhere.
Compliance with the Uyghur Forced Labor Prevention Act requires supply chain due diligence and certification from vendors.
The Uyghur Forced Labor Prevention Act (UFLPA) presents a persistent legal and operational risk, especially for solar companies relying on global supply chains for components like polysilicon. On January 14, 2025, the Department of Homeland Security (DHS) significantly expanded the UFLPA Entity List, adding 37 companies, including several linked to the solar supply chain. This action immediately increased the legal burden on US importers to prove their components are free of forced labor.
Sunnova Energy's public stance, reaffirmed as recently as November 14, 2025, is zero tolerance. They mitigate this risk by requiring every company on their Approved Vendor List (AVL) to provide specific certifications.
- Certify ethical sourcing practices.
- Certify they do not engage in human rights abuses.
- Certify they do not use labor or goods from the Xinjiang region in their supply chain.
Regulatory risk remains high due to ongoing state-level battles over net metering and utility interconnection rules.
Regulatory risk at the state level continues to be a major headwind, directly hitting the economics of residential solar. The most damaging trend is the shift away from one-for-one net metering (NEM), which gives customers full retail credit for excess power sent back to the grid. California's NEM 3.0 is the prime example, forcing solar companies to 'optimize within the current economic and policy landscape.'
This regulatory change effectively devalues the power exported to the grid, making the payback period for a solar system much longer. For a company like Sunnova Energy, whose model relies on long-term power purchase agreements (PPAs) and leases, this is an existential threat to new customer acquisition economics. Plus, utility interconnection rules are also changing, driven by federal reforms from the Federal Energy Regulatory Commission (FERC) like Order No. 2023 and 2023-A, which aim to speed up the process but also introduce a new, more stringent 'first-ready, first-served' cluster study model.
Here's the quick math on the net metering shift:
| Net Metering Policy | Customer Credit for Exported kWh | Impact on Project Economics |
|---|---|---|
| Old Net Metering (1.0/2.0) | 1 kWh exported = 1 kWh retail credit | High (Strongest customer value proposition) |
| New Net Metering (e.g., NEM 3.0) | Requires 4 to 6 kWh exported for 1 kWh retail credit equivalent | Low (Severely cuts customer savings, increases payback time) |
Sunnova Energy International Inc. (NOVA) - PESTLE Analysis: Environmental factors
Carbon Abatement and Climate Impact Metrics
You're looking at Sunnova Energy International Inc. (NOVA) because their core business is fundamentally a climate solution, which is a huge tailwind in the 2025 market. The environmental factor here is not just a compliance issue; it's the entire business model. The most recent data shows the massive scale of their impact.
As of the end of 2023, the total carbon offset from the customer systems they manage already exceeded their goal. The company's customer base is projected to offset a total of 54 million MTCO2e (Metric Tons of Carbon Dioxide Equivalent) over the systems' useful life, which surpassed their 2023 goal of 52 million MTCO2e. This is a crucial number for any ESG-focused investor, showing a clear, measurable commitment to decarbonization.
Here's the quick math on their scale, using the latest reported operational metrics from mid-2024, which is the foundation for their 2025 impact:
| Metric | Value (as of June 30, 2024) | Significance |
|---|---|---|
| Cumulative Solar Power Generation Under Management | 2.8 gigawatts (GW) | Represents the total clean energy capacity installed, directly replacing fossil fuels. |
| Energy Storage Under Management | 1,439 megawatt hours (MWh) | Shows the capacity for grid resilience and peak-shaving, essential for a stable, low-carbon grid. |
| Total Customers (as of 12/31/2023) | Over 400,000 | The size of the residential base contributing to the carbon offset. |
| Solar Panels on New Homes (as of Feb 2025) | Over 1 million | Indicates strong growth in the new-build market, a key driver for future carbon reduction. |
Alignment with Net-Zero Economy and Green Finance
The core business aligns defintely with the global push for a net-zero economy and climate solutions. The residential solar and storage market is a direct enabler of the energy transition, moving power generation closer to the point of consumption, which reduces transmission losses and reliance on centralized, often carbon-intensive, power plants. This positioning makes Sunnova a structural beneficiary of climate-focused policy and capital flows.
To fund this growth, the company utilizes a Green Financing Framework, which guides the issuance of green financings and aligns with the International Capital Market Association's (ICMA) Green Bond Principles. This framework is externally reviewed, having received a Dark Green classification from CICERO Shades of Green-their highest rating-when it was launched.
This commitment to green finance is critical because it:
- Attracts capital from investors with strict ESG mandates.
- Ensures net proceeds are used for eligible green projects like solar and storage systems.
- Diversifies the company's access to capital in a high-interest-rate environment.
Scaling Adaptive Energy Services for Resilience
Sunnova has shifted its focus to scaling adaptive energy services to be environmentally responsible and resilient. This move from a simple 'energy as a service' model to 'adaptive energy services' reflects a strategic recognition that environmental responsibility must be paired with energy security, especially given the rise in extreme weather events across the U.S.
Their adaptive platform is about more than just solar panels; it's about managing the entire home energy system-solar, battery storage, and load control-to provide a reliable, resilient service. This resilience is a key environmental factor because it prevents the need for carbon-intensive backup power (like diesel generators) during grid outages and allows for smarter integration into the wider electricity network.
Concrete examples of this focus include:
- Development of Virtual Power Plants (VPPs), which aggregate residential battery storage to provide services back to the grid, enhancing overall grid stability.
- Investment in the Global Command Center and Adaptive Technology Center to optimize system performance and enhance customer service, which directly translates to maximizing the environmental benefit of each installed system.
What this focus on resilience hides is the rising cost of battery technology and the complexity of managing a distributed network, but the environmental opportunity is huge: a reliable clean energy source is the best climate solution.
Disclaimer
All information, articles, and product details provided on this website are for general informational and educational purposes only. We do not claim any ownership over, nor do we intend to infringe upon, any trademarks, copyrights, logos, brand names, or other intellectual property mentioned or depicted on this site. Such intellectual property remains the property of its respective owners, and any references here are made solely for identification or informational purposes, without implying any affiliation, endorsement, or partnership.
We make no representations or warranties, express or implied, regarding the accuracy, completeness, or suitability of any content or products presented. Nothing on this website should be construed as legal, tax, investment, financial, medical, or other professional advice. In addition, no part of this site—including articles or product references—constitutes a solicitation, recommendation, endorsement, advertisement, or offer to buy or sell any securities, franchises, or other financial instruments, particularly in jurisdictions where such activity would be unlawful.
All content is of a general nature and may not address the specific circumstances of any individual or entity. It is not a substitute for professional advice or services. Any actions you take based on the information provided here are strictly at your own risk. You accept full responsibility for any decisions or outcomes arising from your use of this website and agree to release us from any liability in connection with your use of, or reliance upon, the content or products found herein.