
|
Insight Enterprises, Inc. (NSIT): 5 FORCES Analysis [Nov-2025 Updated] |
Fully Editable: Tailor To Your Needs In Excel Or Sheets
Professional Design: Trusted, Industry-Standard Templates
Investor-Approved Valuation Models
MAC/PC Compatible, Fully Unlocked
No Expertise Is Needed; Easy To Follow
Insight Enterprises, Inc. (NSIT) Bundle
You're looking at Insight Enterprises, Inc. right now, and honestly, the picture is mixed as they push hard into that Solutions Integrator model. We've seen the pressure points clearly: suppliers like Microsoft are flexing their muscle, contributing to that 19% drop in software net sales in Q3 2025, and customers are definitely getting cautious, even as commercial sales hit their sixth straight quarter of growth. With TTM revenue at $8.27 Billion USD and a gross margin guided around 21% for FY 2025, the game is clearly about services differentiation, not just reselling. So, let's cut through the noise and map out exactly where the power lies across their suppliers, customers, rivals, substitutes, and new threats in this late-2025 landscape; it's a defintely necessary deep dive.
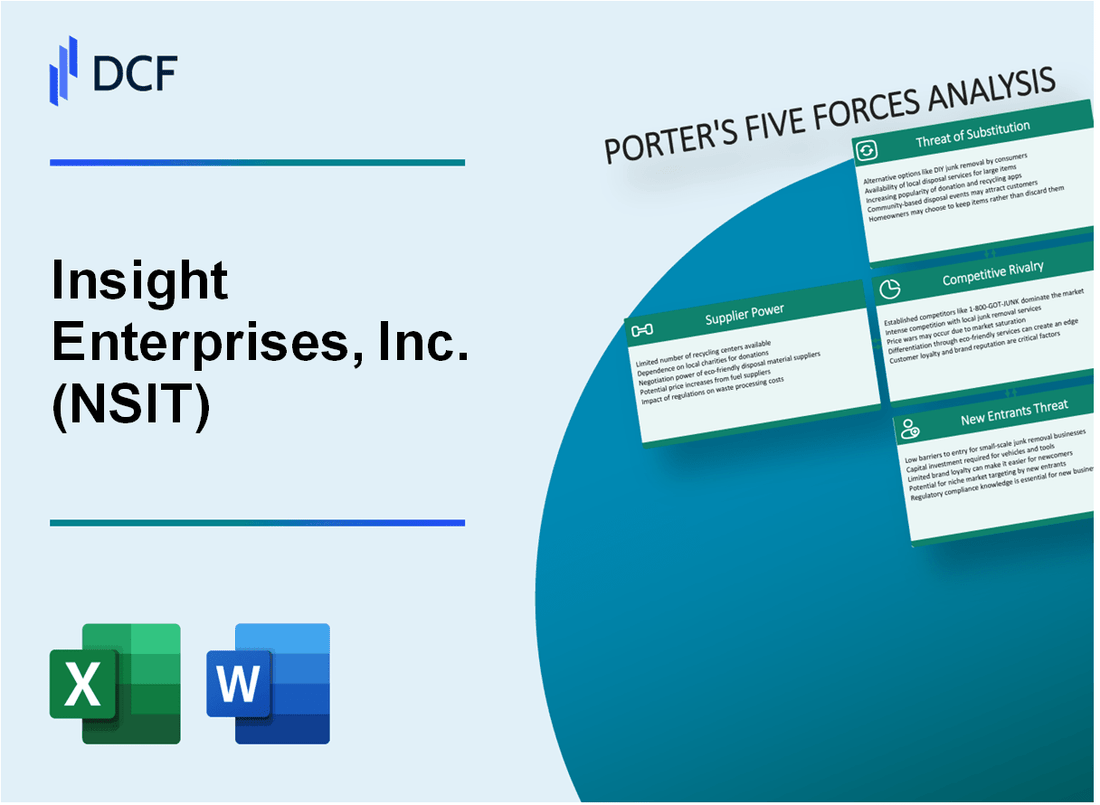
Insight Enterprises, Inc. (NSIT) - Porter's Five Forces: Bargaining power of suppliers
You're looking at Insight Enterprises, Inc. (NSIT) through the lens of supplier power, and honestly, the picture shows a definite concentration of risk. The bargaining power of suppliers is quite elevated because Insight's business model, which blends procurement with consultative services, is fundamentally built on deep, often exclusive, relationships with a small set of technology giants. Insight itself notes its core strength lies in these deep vendor relationships, specifically naming Microsoft, Cisco, and HPE as key partners.
When these critical vendors make a move, Insight feels it directly on the top line. We saw this play out clearly in the third quarter of 2025. Shifts in vendor programs, which the company attributed in part to partner consolidation and program changes, had a measurable impact. Specifically, software product net sales plummeted by 19% year-over-year for Q3 2025. This single data point illustrates how much leverage a primary supplier holds over Insight's revenue mix.
Here's a quick look at the product revenue performance in that quarter to put the software drop in context:
| Product Category (Q3 2025 YoY Change) | Financial Impact |
|---|---|
| Software Product Net Sales | -19% decrease |
| Hardware Product Net Sales | 1% increase |
| Total Product Net Sales | -6% decrease |
It's not just about reselling hardware or software licenses, though. The suppliers control the essential intellectual property (IP) and the foundational cloud platforms that power Insight's growth services. We're talking about Amazon Web Services (AWS), Microsoft Azure, and Google Cloud Platform (GCP). Together, these three giants command more than 65% of global cloud infrastructure spending as of 2025. Insight's own cloud gross profit grew 7% in Q3 2025, showing the importance of these platforms, but also their gatekeeping power.
The reliance on these ecosystems creates structural barriers for Insight Enterprises. You can't just swap out Azure for a non-existent competitor overnight. This dependence translates into high switching costs for Insight because of the specialized talent required to maintain partner status and service delivery.
- Insight maintains competencies for AWS Security, DevOps, and Microsoft Workloads.
- The company deploys over 6,400 engineers, architects, and tech field consultants to manage these complex environments.
- Maintaining premier partner status with vendors like Microsoft requires continuous investment in specific certifications.
- Cloud Optimization Services, like InsightCloud Care for Azure, include training on vendor-specific tools like Azure Cost Manager.
This deep technical expertise, while a strength for client delivery, locks Insight into the supplier's technology stack. If Microsoft or AWS tightens its partner requirements or changes its incentive structure-as seen with the partner program changes impacting revenue-Insight has limited recourse but to comply and absorb the cost or risk. That's the reality of high supplier power in this space; you must invest heavily to stay certified or risk losing access to the products your customers demand.
Finance: draft a sensitivity analysis on a 10% negative change in Microsoft-related software revenue by next Tuesday.
Insight Enterprises, Inc. (NSIT) - Porter's Five Forces: Bargaining power of customers
You're looking at the customer power dynamic for Insight Enterprises, Inc. (NSIT) right now, and honestly, it's a mixed bag, leaning toward moderate to high leverage for the buyer. The reality in late 2025 is that large enterprise clients are definitely showing caution, which translates directly into project delays and tougher price negotiations for Insight Enterprises. This hesitancy is a major factor pushing down on margins, even as the company fights hard on other fronts.
The ease of switching suppliers is a core driver of this power. Customers have plenty of comparable options, whether they look to direct manufacturers for hardware or compete Insight Enterprises against other large, established IT resellers. Plus, the direct procurement route from hyperscalers like Amazon Web Services (AWS) or Microsoft Azure for cloud services is always an easy alternative for the customer. This constant comparison makes price a very sensitive lever in any deal.
Still, Insight Enterprises isn't just taking the pressure. The commercial segment is proving resilient. Commercial net sales grew for the sixth straight quarter in Q3 2025, which is a clear positive signal that a segment of the customer base is still investing and buying. This sustained growth somewhat balances the evident hesitancy we see from the largest accounts.
Here are the key numbers from the Q3 2025 results that frame this customer dynamic. The overall consolidated net sales for the quarter landed at $2.0 billion, representing a 4% year-over-year decrease, which shows the broader market headwinds. However, the gross margin hit a record 21.7% in Q3 2025, a 100 basis point expansion over the prior year, showing operational strength or favorable product mix offsetting some price pressure.
The sensitivity of the business to customer negotiation is best seen in the full-year outlook versus the quarterly performance. Insight Enterprises' gross margin is guided to approximately 21% for FY 2025. That guidance suggests management expects some margin compression from the Q3 actual of 21.7% as the year closes out, likely due to those large client negotiations or project mix shifts.
Here's a quick look at how the different customer segments and competitive realities are showing up in the financials:
| Metric | Value (Late 2025 Data) | Force Implication |
|---|---|---|
| Commercial Net Sales Growth | Grew for the sixth straight quarter | Mitigates customer power in this segment. |
| Consolidated Net Sales (Q3 2025) | $2.0 billion (down 4% YoY) | Overall market caution limits customer spending power. |
| Insight Core Services Gross Profit (Q3 2025) | Decreased 3% YoY | Directly reflects large enterprise project delays. |
| FY 2025 Gross Margin Guidance | Approximately 21% | The target margin is sensitive to customer price demands. |
| Cloud Gross Profit Growth (Q3 2025) | Increased 7% YoY | Customers are shifting spend to easily procured cloud services. |
The power of these buyers is structurally high because of the alternatives available. You can see the ease of switching in the segment performance:
- Customers can easily pivot to direct procurement from cloud providers.
- Cloud gross profit growth was 7% in Q3 2025, outpacing other areas.
- Insight Core Services gross profit fell 3% due to large client spending decline.
- The company's overall revenue was down 4% in Q3 2025.
- Year-to-date net sales through Q3 2025 declined 6%.
To be fair, the company is managing its expenses well to counter this. Adjusted selling and administrative expenses decreased 1% year-over-year in Q3 2025. Finance: draft a sensitivity analysis showing the impact of a 100 basis point drop in gross margin from the 21% guidance by next Tuesday.
Insight Enterprises, Inc. (NSIT) - Porter's Five Forces: Competitive rivalry
Rivalry is intense with direct, large-scale competitors like CDW, TD SYNNEX, and PC Connection. You see this pressure reflected in the top-line numbers, where Insight Enterprises, Inc. (NSIT) reported a TTM revenue of $8.27 Billion USD as of November 2025, placing it firmly in a mature, high-volume segment where market share gains often come at the expense of another player.
The market is highly fragmented, with competition across hardware, software, and services, driving consolidation activity. To illustrate the scale difference in this crowded space, look at the latest reported revenue figures for the key players:
| Competitor | Latest Reported Revenue Metric | Amount |
| Insight Enterprises (NSIT) | TTM Revenue (Nov 2025) | $8.27 Billion USD |
| CDW | TTM Revenue (ending Sep 30, 2025) | $22.10B |
| TD SYNNEX (SNX) | TTM Revenue (ending Aug 31, 2025) | $60.974B |
| PC Connection (CNXN) | TTM Revenue (ending Sep 30, 2025) | $2.88B |
The strategic shift to high-margin AI and services is a direct competitive move to differentiate from pure resellers. Insight Enterprises launched Insight AI on November 12, 2025, aiming to capture higher-value project work. This is a necessary countermeasure, especially when looking at segment performance, where cloud gross profits grew a healthy 7% year-over-year in Q3 2025, while the core hardware business faced headwinds.
Still, the overall market environment is challenging, which you see clearly in the top-line results. Insight Enterprises net sales decreased 4% year-over-year in Q3 2025, hitting $2.0 billion for the quarter. This suggests a zero-sum environment where macro uncertainty forces customers to delay large IT purchases. For instance, the large enterprise and corporate customer base, which accounted for 68% of revenue for the nine months ended September 2025, saw a 9% revenue decline during that same period.
The competitive dynamics force segmentation strategies, but even those show mixed results:
- Large Enterprise/Corporate Revenue Decline (9M YTD 2025): 9%
- Commercial Customer Revenue Increase (YTD Q3 2025): 8%
- Public Sector Revenue Decline (YTD Q3 2025): low-teen percent area
- Software Product Net Sales Decline (Q3 2025 YoY): 19%
- Hardware Product Net Sales Increase (Q3 2025 YoY): 1%
When you compare this pressure to competitors like CDW, which reported Q3 2025 net sales growth of 4.0% year-over-year, or TD SYNNEX, which saw Q3 2025 revenue increase 6.6% year-over-year, Insight Enterprises' 4% decline in Q3 2025 net sales highlights the specific competitive friction it is facing in its core segments. PC Connection, while smaller, showed a strong Q1 2025 net sales increase of 10.9%, showing that pockets of the market are still expanding rapidly.
Insight Enterprises, Inc. (NSIT) - Porter's Five Forces: Threat of substitutes
The threat of substitutes for Insight Enterprises, Inc. remains a significant structural force, primarily driven by customers bypassing traditional reseller and integration channels. The primary substitute involves direct procurement of IT assets and cloud services. For instance, in the third quarter of 2025, Insight Enterprises reported product net sales decreased 6% year-over-year to $1.3 billion, with software product net sales specifically contracting by 19% year-over-year. This suggests that a substantial portion of what was once Insight Enterprises' reselling business is being substituted by direct purchasing or consumption models from original equipment manufacturers (OEMs) and Hyperscalers.
Customers can substitute Insight Enterprises' consulting and integration services with internal IT teams or specialized, pure-play consulting firms. Consider Cognizant, a major pure-play services provider, which reported third-quarter 2025 revenue growth of 6.5% year-over-year in constant currency and raised its full-year 2025 constant currency revenue growth outlook to 6.0% to 6.3%. This contrasts with Insight Enterprises' overall services segment, where services net sales increased 3% year-over-year to $426 million in Q3 2025, and North America services net sales actually decreased 3% year-over-year to $317.3 million. The market for system integrators overall is valued at USD 590.09 billion in 2025, projected to grow at a 14.18% CAGR through 2034, indicating strong underlying demand for integration, but also intense competition from firms focused purely on services delivery.
The structural shift to Software-as-a-Service (SaaS) and Infrastructure-as-a-Service (IaaS) directly reduces the need for traditional hardware reselling services, which Insight Enterprises is clearly feeling, given the 19% year-over-year drop in on-prem software sales in Q3 2025. However, the cloud consumption model is not a full substitute for Insight Enterprises; rather, it is a channel shift. The company's cloud business showed particular strength, with cloud gross profit growing 7% year-over-year to $130 million in Q3 2025. This demonstrates that while the type of service is changing, the need for a partner to manage and optimize that consumption remains.
Insight Enterprises counters this threat by evolving into a Solutions Integrator, focusing on complex, non-substitutable areas like AI and cybersecurity. This strategic pivot is evident in their stated identity as an 'AI-First Solutions Integrator' and recent actions. They are investing heavily in expanding advisory, data, and cybersecurity capabilities, underscored by the announced acquisitions of Inspire 11, a data and AI consultancy, and Sekuro, an APAC cybersecurity provider. The company's full-year 2025 guidance projects an Adjusted diluted EPS range between $9.60 and $9.90, reflecting a focus on profitability over top-line volume in the face of macro headwinds.
Here's a quick look at the segment dynamics illustrating the substitution pressure and the strategic focus:
| Metric | Value (Q3 2025) | Year-over-Year Change | Implication for Substitution |
|---|---|---|---|
| Total Net Sales | $2.0 billion | -4% | Overall market pressure impacting legacy sales. |
| Services Net Sales (Total) | $426 million | +3% | Services revenue is growing, but slower than pure-play competitors. |
| Insight Core Services Gross Profit | $79 million | -3% | Traditional consulting services face direct substitution risk. |
| Cloud Gross Profit | $130 million | +7% | Cloud consumption is growing, replacing on-prem hardware/software sales. |
| Software Product Net Sales | N/A | -19% | Direct evidence of substitution away from on-prem software reselling. |
The company's efforts to build non-substitutable value are centered on high-growth, high-complexity areas. You need to watch these service lines closely as they define the success of the transformation. Key areas of focus include:
- Advancing the Insight AI offerings, including governance and ROI tools.
- Bolstering cybersecurity capabilities via strategic acquisitions like Sekuro.
- Expanding data and AI consultancy through the Inspire 11 acquisition.
- Maintaining strong gross margin, which reached a record 21.7% in Q3 2025.
- Generating robust operating cash flow of $249 million in Q3 2025 to fund this pivot.
If onboarding for these new AI/cybersecurity services takes longer than expected, churn risk rises.
Insight Enterprises, Inc. (NSIT) - Porter's Five Forces: Threat of new entrants
You're looking at the competitive landscape for Insight Enterprises, Inc. (NSIT) as we head into late 2025, and the threat of new entrants is definitely a mixed bag. Honestly, the threat is assessed as moderate because the sheer scale required to compete across the board presents a significant hurdle.
Initial capital requirements and the necessity for a global operational footprint are high barriers. Think about the infrastructure needed to support a global solutions integrator; it isn't trivial. New entrants struggle to replicate the deep, multi-vendor partnerships, like those Insight Enterprises, Inc. has cultivated over 37 years with giants such as Microsoft and Cisco. These relationships are sticky and take decades to build.
Still, the market size itself is a magnet for specialized players. The market for IT services stands at $1,518.1 billion in 2025, which is huge, and that size attracts new, niche firms focused on bleeding-edge areas like AI or specialized cybersecurity. Here's a quick look at how the market size is being reported for 2025:
| Source | Reported 2025 Market Size |
|---|---|
| Mordor Intelligence | $1,518.1 billion |
| Precedence Research | $1.61 trillion |
| Fortune Business Insights | $1.43 trillion |
New entrants can easily target lower-margin, commoditized segments, like basic help-desk tasks, by using automation and offshore models to undercut established pricing structures. They don't need Insight Enterprises, Inc.'s full portfolio to win a small contract.
However, Insight Enterprises, Inc.'s recent strategic moves raise the bar for expertise significantly. The acquisitions of Inspire11 and Sekuro are designed to block off easy entry points into high-value services. These moves require a new entrant to possess comparable, specialized knowledge right out of the gate.
The expertise gained from these recent deals is substantial, making the specialized knowledge barrier higher:
- Inspire11 brings AI/Data transformation expertise.
- Sekuro provides specialized cybersecurity and resiliency.
- Inspire11's platform can deliver up to an 80% increase in velocity.
- Sekuro was acquired for an upfront payment of about $297 million in Q4 2025.
- Service business gross margins are in the low-60% area, far above hardware margins.
To compete effectively in the high-margin service layer, a new firm would need to match this specialized capability, which requires significant investment. For context on Insight Enterprises, Inc.'s own scale, the company forecasts its S&P Global Ratings-adjusted leverage to be in the 2.8x area by the end of 2025, supported by a large $1.8 billion asset-based lending facility. That level of financial backing is tough for a startup to match quickly.
Finance: draft 13-week cash view by Friday.
Disclaimer
All information, articles, and product details provided on this website are for general informational and educational purposes only. We do not claim any ownership over, nor do we intend to infringe upon, any trademarks, copyrights, logos, brand names, or other intellectual property mentioned or depicted on this site. Such intellectual property remains the property of its respective owners, and any references here are made solely for identification or informational purposes, without implying any affiliation, endorsement, or partnership.
We make no representations or warranties, express or implied, regarding the accuracy, completeness, or suitability of any content or products presented. Nothing on this website should be construed as legal, tax, investment, financial, medical, or other professional advice. In addition, no part of this site—including articles or product references—constitutes a solicitation, recommendation, endorsement, advertisement, or offer to buy or sell any securities, franchises, or other financial instruments, particularly in jurisdictions where such activity would be unlawful.
All content is of a general nature and may not address the specific circumstances of any individual or entity. It is not a substitute for professional advice or services. Any actions you take based on the information provided here are strictly at your own risk. You accept full responsibility for any decisions or outcomes arising from your use of this website and agree to release us from any liability in connection with your use of, or reliance upon, the content or products found herein.