
|
NetScout Systems, Inc. (NTCT) DCF Valuation |
Fully Editable: Tailor To Your Needs In Excel Or Sheets
Professional Design: Trusted, Industry-Standard Templates
Investor-Approved Valuation Models
MAC/PC Compatible, Fully Unlocked
No Expertise Is Needed; Easy To Follow
NetScout Systems, Inc. (NTCT) Bundle
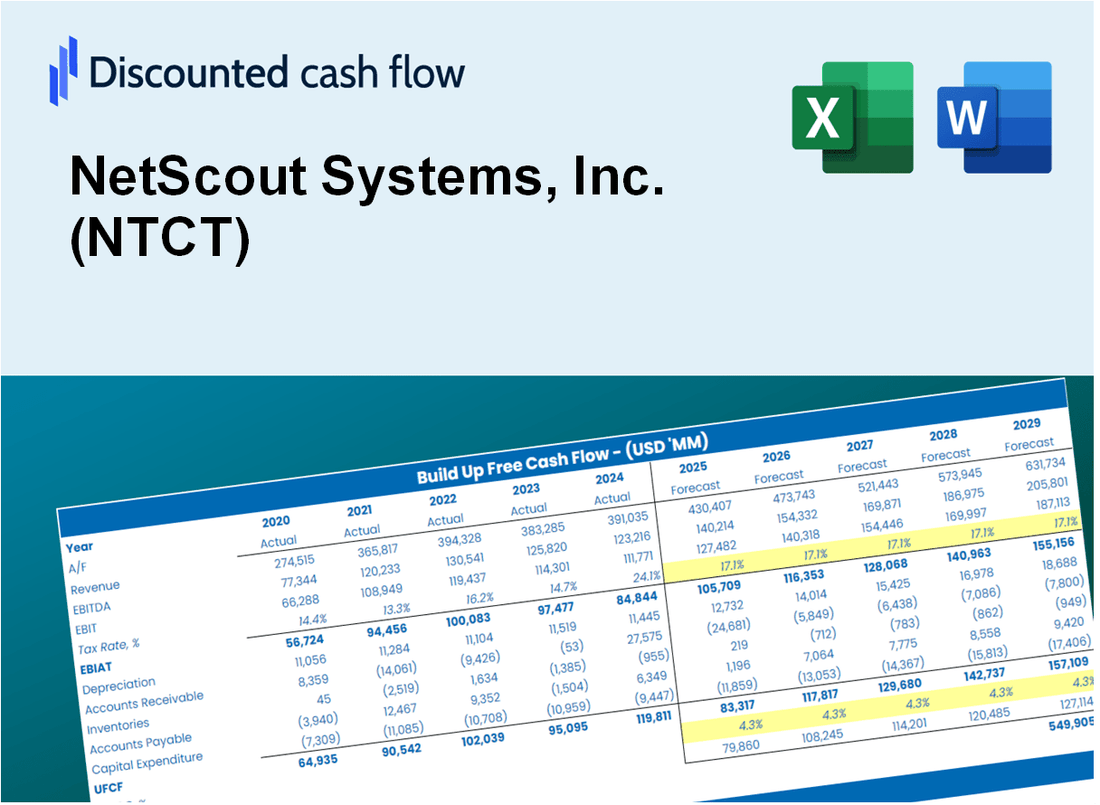
Gain insight into your NetScout Systems, Inc. (NTCT) valuation analysis using our cutting-edge DCF Calculator! Preloaded with real (NTCT) data, this Excel template enables you to adjust forecasts and assumptions to accurately determine the intrinsic value of NetScout Systems, Inc. (NTCT).
Discounted Cash Flow (DCF) - (USD MM)
| Year | AY1 2021 |
AY2 2022 |
AY3 2023 |
AY4 2024 |
AY5 2025 |
FY1 2026 |
FY2 2027 |
FY3 2028 |
FY4 2029 |
FY5 2030 |
|---|---|---|---|---|---|---|---|---|---|---|
| Revenue | 831.3 | 855.6 | 914.5 | 829.5 | 822.7 | 822.0 | 821.4 | 820.8 | 820.2 | 819.5 |
| Revenue Growth, % | 0 | 2.92 | 6.89 | -9.3 | -0.81692 | -0.07661833 | -0.07661833 | -0.07661833 | -0.07661833 | -0.07661833 |
| EBITDA | 139.0 | 146.7 | 174.0 | -60.9 | -294.8 | 16.0 | 16.0 | 16.0 | 15.9 | 15.9 |
| EBITDA, % | 16.72 | 17.15 | 19.03 | -7.34 | -35.84 | 1.94 | 1.94 | 1.94 | 1.94 | 1.94 |
| Depreciation | 105.8 | 95.8 | 95.4 | 75.0 | 63.8 | 84.1 | 84.0 | 84.0 | 83.9 | 83.8 |
| Depreciation, % | 12.73 | 11.2 | 10.43 | 9.04 | 7.75 | 10.23 | 10.23 | 10.23 | 10.23 | 10.23 |
| EBIT | 33.2 | 50.9 | 78.7 | -135.9 | -358.6 | -68.1 | -68.1 | -68.0 | -68.0 | -67.9 |
| EBIT, % | 3.99 | 5.95 | 8.6 | -16.38 | -43.59 | -8.29 | -8.29 | -8.29 | -8.29 | -8.29 |
| Total Cash | 476.5 | 703.2 | 419.0 | 423.1 | 491.5 | 486.8 | 486.4 | 486.0 | 485.7 | 485.3 |
| Total Cash, percent | .0 | .0 | .0 | .0 | .0 | .0 | .0 | .0 | .0 | .0 |
| Account Receivables | 197.7 | 148.2 | 143.9 | 192.1 | 163.7 | 164.2 | 164.1 | 164.0 | 163.9 | 163.7 |
| Account Receivables, % | 23.78 | 17.33 | 15.73 | 23.16 | 19.89 | 19.98 | 19.98 | 19.98 | 19.98 | 19.98 |
| Inventories | 19.4 | 21.2 | 17.5 | 14.1 | 11.1 | 16.1 | 16.1 | 16.1 | 16.0 | 16.0 |
| Inventories, % | 2.33 | 2.48 | 1.92 | 1.7 | 1.35 | 1.96 | 1.96 | 1.96 | 1.96 | 1.96 |
| Accounts Payable | 18.0 | 22.0 | 16.5 | 14.5 | 18.2 | 17.2 | 17.2 | 17.2 | 17.2 | 17.2 |
| Accounts Payable, % | 2.16 | 2.57 | 1.8 | 1.75 | 2.21 | 2.1 | 2.1 | 2.1 | 2.1 | 2.1 |
| Capital Expenditure | -16.5 | -10.4 | -10.6 | -6.3 | -6.7 | -9.8 | -9.8 | -9.8 | -9.8 | -9.7 |
| Capital Expenditure, % | -1.99 | -1.22 | -1.16 | -0.764 | -0.81405 | -1.19 | -1.19 | -1.19 | -1.19 | -1.19 |
| Tax Rate, % | -0.30837 | -0.30837 | -0.30837 | -0.30837 | -0.30837 | -0.30837 | -0.30837 | -0.30837 | -0.30837 | -0.30837 |
| EBITAT | 28.8 | 42.6 | 68.6 | -138.9 | -359.7 | -62.3 | -62.3 | -62.2 | -62.2 | -62.1 |
| Depreciation | ||||||||||
| Changes in Account Receivables | ||||||||||
| Changes in Inventories | ||||||||||
| Changes in Accounts Payable | ||||||||||
| Capital Expenditure | ||||||||||
| UFCF | -81.0 | 179.6 | 155.9 | -117.0 | -267.5 | 5.5 | 12.1 | 12.1 | 12.1 | 12.1 |
| WACC, % | 6.99 | 6.98 | 6.99 | 7.03 | 7.03 | 7 | 7 | 7 | 7 | 7 |
| PV UFCF | ||||||||||
| SUM PV UFCF | 43.4 | |||||||||
| Long Term Growth Rate, % | 4.00 | |||||||||
| Free cash flow (T + 1) | 13 | |||||||||
| Terminal Value | 418 | |||||||||
| Present Terminal Value | 298 | |||||||||
| Enterprise Value | 341 | |||||||||
| Net Debt | -414 | |||||||||
| Equity Value | 755 | |||||||||
| Diluted Shares Outstanding, MM | 73 | |||||||||
| Equity Value Per Share | 10.41 |
What You Will Get
- Editable Excel Template: A fully customizable Excel-based DCF Calculator featuring pre-filled real NTCT financials.
- Real-World Data: Historical data and forward-looking estimates (as shown in the yellow cells).
- Forecast Flexibility: Adjust forecast assumptions such as revenue growth, EBITDA %, and WACC.
- Automatic Calculations: Instantly observe the effects of your inputs on NetScout's valuation.
- Professional Tool: Designed for investors, CFOs, consultants, and financial analysts.
- User-Friendly Design: Organized for clarity and ease of use, complete with step-by-step instructions.
Key Features
- Comprehensive Data: NetScout's historical financial reports and pre-filled projections.
- Customizable Parameters: Modify WACC, tax rates, revenue growth, and EBITDA margins.
- Real-Time Insights: Watch NetScout's intrinsic value update instantly.
- Intuitive Visualizations: Dashboard graphs showcase valuation outcomes and essential metrics.
- Precision Engineered: A reliable tool for analysts, investors, and finance professionals.
How It Works
- 1. Access the Template: Download and open the Excel file containing NetScout Systems, Inc.'s (NTCT) preloaded data.
- 2. Modify Assumptions: Adjust key inputs such as growth projections, WACC, and capital expenditures.
- 3. Instant Results: The DCF model automatically calculates intrinsic value and NPV in real-time.
- 4. Explore Scenarios: Evaluate various forecasts to assess different valuation results.
- 5. Present with Confidence: Deliver professional valuation insights to enhance your decision-making.
Why Choose NetScout's Solutions?
- Reliability: Proven technology ensures dependable performance for your network.
- Scalability: Solutions designed to grow with your business needs.
- Efficiency: Streamline network management to save time and resources.
- Expertise: Built with insights from industry leaders and network specialists.
- Intuitive Interface: User-friendly design makes it accessible for all team members.
Who Should Use This Product?
- Individual Investors: Gain insights to make informed decisions regarding investments in NetScout Systems, Inc. (NTCT).
- Financial Analysts: Enhance valuation processes with comprehensive financial models tailored for NetScout Systems, Inc. (NTCT).
- Consultants: Provide clients with accurate and professional valuation insights related to NetScout Systems, Inc. (NTCT).
- Business Owners: Learn about the valuation methods of technology companies like NetScout Systems, Inc. (NTCT) to inform your own business strategies.
- Finance Students: Explore real-world data and scenarios to master valuation techniques relevant to NetScout Systems, Inc. (NTCT).
What the Template Contains
- Historical Data: Includes NetScout Systems, Inc.'s (NTCT) past financials and baseline forecasts.
- DCF and Levered DCF Models: Detailed templates to calculate NetScout Systems, Inc.'s (NTCT) intrinsic value.
- WACC Sheet: Pre-built calculations for Weighted Average Cost of Capital.
- Editable Inputs: Modify key drivers like growth rates, EBITDA %, and CAPEX assumptions.
- Quarterly and Annual Statements: A complete breakdown of NetScout Systems, Inc.'s (NTCT) financials.
- Interactive Dashboard: Visualize valuation results and projections dynamically.
Disclaimer
All information, articles, and product details provided on this website are for general informational and educational purposes only. We do not claim any ownership over, nor do we intend to infringe upon, any trademarks, copyrights, logos, brand names, or other intellectual property mentioned or depicted on this site. Such intellectual property remains the property of its respective owners, and any references here are made solely for identification or informational purposes, without implying any affiliation, endorsement, or partnership.
We make no representations or warranties, express or implied, regarding the accuracy, completeness, or suitability of any content or products presented. Nothing on this website should be construed as legal, tax, investment, financial, medical, or other professional advice. In addition, no part of this site—including articles or product references—constitutes a solicitation, recommendation, endorsement, advertisement, or offer to buy or sell any securities, franchises, or other financial instruments, particularly in jurisdictions where such activity would be unlawful.
All content is of a general nature and may not address the specific circumstances of any individual or entity. It is not a substitute for professional advice or services. Any actions you take based on the information provided here are strictly at your own risk. You accept full responsibility for any decisions or outcomes arising from your use of this website and agree to release us from any liability in connection with your use of, or reliance upon, the content or products found herein.