
|
Novartis AG (NVS) DCF Valuation |
Fully Editable: Tailor To Your Needs In Excel Or Sheets
Professional Design: Trusted, Industry-Standard Templates
Investor-Approved Valuation Models
MAC/PC Compatible, Fully Unlocked
No Expertise Is Needed; Easy To Follow
Novartis AG (NVS) Bundle
Looking to assess the intrinsic value of Novartis AG? Our (NVS) DCF Calculator integrates real-world data with comprehensive customization features, allowing you to adjust forecasts and enhance your investment strategies.
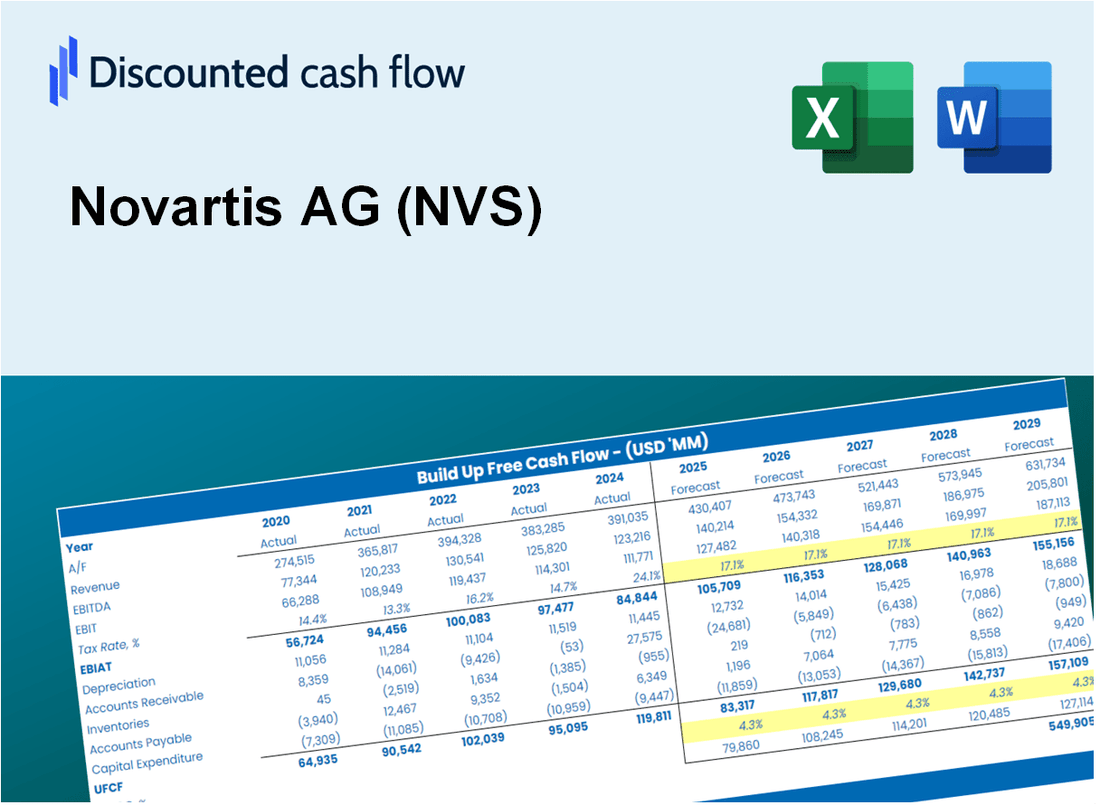
Discounted Cash Flow (DCF) - (USD MM)
| Year | AY1 2020 |
AY2 2021 |
AY3 2022 |
AY4 2023 |
AY5 2024 |
FY1 2025 |
FY2 2026 |
FY3 2027 |
FY4 2028 |
FY5 2029 |
|---|---|---|---|---|---|---|---|---|---|---|
| Revenue | 49,898.0 | 43,974.0 | 43,461.0 | 46,660.0 | 51,722.0 | 52,390.6 | 53,067.8 | 53,753.8 | 54,448.6 | 55,152.4 |
| Revenue Growth, % | 0 | -11.87 | -1.17 | 7.36 | 10.85 | 1.29 | 1.29 | 1.29 | 1.29 | 1.29 |
| EBITDA | 17,211.0 | 30,914.0 | 14,682.0 | 18,255.0 | 20,715.0 | 22,816.0 | 23,110.9 | 23,409.7 | 23,712.3 | 24,018.8 |
| EBITDA, % | 34.49 | 70.3 | 33.78 | 39.12 | 40.05 | 43.55 | 43.55 | 43.55 | 43.55 | 43.55 |
| Depreciation | 6,464.0 | 5,597.0 | 6,705.0 | 8,277.0 | 6,069.0 | 7,395.8 | 7,491.4 | 7,588.2 | 7,686.3 | 7,785.6 |
| Depreciation, % | 12.95 | 12.73 | 15.43 | 17.74 | 11.73 | 14.12 | 14.12 | 14.12 | 14.12 | 14.12 |
| EBIT | 10,747.0 | 25,317.0 | 7,977.0 | 9,978.0 | 14,646.0 | 15,420.2 | 15,619.6 | 15,821.5 | 16,026.0 | 16,233.1 |
| EBIT, % | 21.54 | 57.57 | 18.35 | 21.38 | 28.32 | 29.43 | 29.43 | 29.43 | 29.43 | 29.43 |
| Total Cash | 11,563.0 | 28,329.0 | 18,930.0 | 13,962.0 | 13,351.0 | 19,582.3 | 19,835.4 | 20,091.8 | 20,351.5 | 20,614.6 |
| Total Cash, percent | .0 | .0 | .0 | .0 | .0 | .0 | .0 | .0 | .0 | .0 |
| Account Receivables | 9,073.0 | 8,828.0 | 8,936.0 | 8,124.0 | 8,211.0 | 9,651.0 | 9,775.7 | 9,902.1 | 10,030.1 | 10,159.7 |
| Account Receivables, % | 18.18 | 20.08 | 20.56 | 17.41 | 15.88 | 18.42 | 18.42 | 18.42 | 18.42 | 18.42 |
| Inventories | 7,131.0 | 6,666.0 | 7,175.0 | 5,913.0 | 5,723.0 | 7,302.9 | 7,397.3 | 7,492.9 | 7,589.8 | 7,687.9 |
| Inventories, % | 14.29 | 15.16 | 16.51 | 12.67 | 11.06 | 13.94 | 13.94 | 13.94 | 13.94 | 13.94 |
| Accounts Payable | 5,403.0 | 5,553.0 | 5,146.0 | 4,926.0 | 4,572.0 | 5,730.8 | 5,804.9 | 5,879.9 | 5,955.9 | 6,032.9 |
| Accounts Payable, % | 10.83 | 12.63 | 11.84 | 10.56 | 8.84 | 10.94 | 10.94 | 10.94 | 10.94 | 10.94 |
| Capital Expenditure | -2,585.0 | -2,971.0 | -2,671.0 | -2,753.0 | -3,814.0 | -3,285.6 | -3,328.1 | -3,371.1 | -3,414.7 | -3,458.8 |
| Capital Expenditure, % | -5.18 | -6.76 | -6.15 | -5.9 | -7.37 | -6.27 | -6.27 | -6.27 | -6.27 | -6.27 |
| Tax Rate, % | 12.46 | 12.46 | 12.46 | 12.46 | 12.46 | 12.46 | 12.46 | 12.46 | 12.46 | 12.46 |
| EBITAT | 8,782.1 | 24,791.7 | 7,730.3 | 16,241.7 | 12,821.7 | 14,312.8 | 14,497.9 | 14,685.3 | 14,875.1 | 15,067.4 |
| Depreciation | ||||||||||
| Changes in Account Receivables | ||||||||||
| Changes in Inventories | ||||||||||
| Changes in Accounts Payable | ||||||||||
| Capital Expenditure | ||||||||||
| UFCF | 1,860.1 | 28,277.7 | 10,740.3 | 23,619.7 | 14,825.7 | 16,562.0 | 18,516.1 | 18,755.4 | 18,997.9 | 19,243.4 |
| WACC, % | 6.02 | 6.09 | 6.09 | 6.1 | 6.05 | 6.07 | 6.07 | 6.07 | 6.07 | 6.07 |
| PV UFCF | ||||||||||
| SUM PV UFCF | 77,129.2 | |||||||||
| Long Term Growth Rate, % | 2.00 | |||||||||
| Free cash flow (T + 1) | 19,628 | |||||||||
| Terminal Value | 482,290 | |||||||||
| Present Terminal Value | 359,211 | |||||||||
| Enterprise Value | 436,340 | |||||||||
| Net Debt | 19,799 | |||||||||
| Equity Value | 416,541 | |||||||||
| Diluted Shares Outstanding, MM | 2,035 | |||||||||
| Equity Value Per Share | 204.69 |
What You Will Receive
- Pre-Filled Financial Model: Novartis AG's (NVS) actual data facilitates accurate DCF valuation.
- Comprehensive Forecast Control: Modify revenue growth, profit margins, WACC, and other critical factors.
- Real-Time Calculations: Automatic updates provide immediate results as adjustments are made.
- Professional-Grade Template: A polished Excel file crafted for high-quality valuation.
- Flexible and Reusable: Designed for adaptability, allowing for repeated use in detailed forecasting.
Key Features
- Pre-Loaded Data: Novartis AG’s historical financial statements and pre-filled forecasts.
- Fully Adjustable Inputs: Modify WACC, tax rates, revenue growth, and EBITDA margins as needed.
- Instant Results: View Novartis AG’s intrinsic value recalculating in real time.
- Clear Visual Outputs: Dashboard charts present valuation results and key metrics effectively.
- Built for Accuracy: A professional tool designed for analysts, investors, and finance experts.
How It Works
- Download: Get the pre-built Excel file containing Novartis AG's (NVS) financial data.
- Customize: Modify forecasts, including sales growth, EBITDA margin, and discount rate.
- Update Automatically: The intrinsic value and NPV calculations refresh in real-time.
- Test Scenarios: Develop various projections and instantly analyze different outcomes.
- Make Decisions: Leverage the valuation insights to inform your investment choices.
Why Choose This Calculator for Novartis AG (NVS)?
- Designed for Experts: A sophisticated tool utilized by analysts, CFOs, and healthcare consultants.
- Comprehensive Data: Novartis’ historical and projected financials preloaded for precise analysis.
- Scenario Analysis: Effortlessly simulate various forecasts and assumptions.
- Clear Results: Automatically computes intrinsic value, NPV, and essential metrics.
- User-Friendly: Step-by-step guidance helps you navigate the calculations with ease.
Who Should Use This Product?
- Investors: Evaluate Novartis AG’s valuation prior to making investment decisions.
- CFOs and Financial Analysts: Optimize valuation workflows and assess financial forecasts.
- Startup Founders: Understand the valuation methods applied to large pharmaceutical companies like Novartis AG.
- Consultants: Provide detailed valuation analyses and reports for clients in the healthcare sector.
- Students and Educators: Utilize current data to learn and instruct on valuation methodologies.
What the Template Contains
- Comprehensive DCF Model: Editable template featuring in-depth valuation calculations.
- Real-World Data: Novartis AG's (NVS) historical and projected financials preloaded for thorough analysis.
- Customizable Parameters: Modify WACC, growth rates, and tax assumptions to explore different scenarios.
- Financial Statements: Complete annual and quarterly breakdowns for enhanced insights.
- Key Ratios: Integrated analysis for profitability, efficiency, and leverage metrics.
- Dashboard with Visual Outputs: Charts and tables providing clear, actionable results.
Disclaimer
All information, articles, and product details provided on this website are for general informational and educational purposes only. We do not claim any ownership over, nor do we intend to infringe upon, any trademarks, copyrights, logos, brand names, or other intellectual property mentioned or depicted on this site. Such intellectual property remains the property of its respective owners, and any references here are made solely for identification or informational purposes, without implying any affiliation, endorsement, or partnership.
We make no representations or warranties, express or implied, regarding the accuracy, completeness, or suitability of any content or products presented. Nothing on this website should be construed as legal, tax, investment, financial, medical, or other professional advice. In addition, no part of this site—including articles or product references—constitutes a solicitation, recommendation, endorsement, advertisement, or offer to buy or sell any securities, franchises, or other financial instruments, particularly in jurisdictions where such activity would be unlawful.
All content is of a general nature and may not address the specific circumstances of any individual or entity. It is not a substitute for professional advice or services. Any actions you take based on the information provided here are strictly at your own risk. You accept full responsibility for any decisions or outcomes arising from your use of this website and agree to release us from any liability in connection with your use of, or reliance upon, the content or products found herein.