
|
Nextracker Inc. (NXT) DCF Valuation |
Fully Editable: Tailor To Your Needs In Excel Or Sheets
Professional Design: Trusted, Industry-Standard Templates
Investor-Approved Valuation Models
MAC/PC Compatible, Fully Unlocked
No Expertise Is Needed; Easy To Follow
Nextracker Inc. (NXT) Bundle
Streamline your analysis and improve precision with our Nextracker Inc. (NXT) DCF Calculator! Utilizing real data from Nextracker and customizable assumptions, this tool empowers you to forecast, analyze, and value Nextracker Inc. (NXT) just like a seasoned investor.
What You Will Receive
- Authentic Nextracker Data: Comprehensive financials – encompassing revenue to EBIT – derived from actual and forecasted figures.
- Complete Customization: Modify all essential parameters (highlighted cells) such as WACC, growth %, and tax rates.
- Immediate Valuation Adjustments: Automatic recalculations to assess the impact of modifications on Nextracker’s fair value.
- Flexible Excel Template: Designed for quick edits, scenario analysis, and in-depth projections.
- Efficient and Precise: Eliminate the hassle of building models from scratch while ensuring accuracy and adaptability.
Nextracker Inc. (NXT) Key Features
- Customizable Forecast Settings: Adjust essential metrics such as revenue growth, EBITDA margin, and capital investment.
- Instant DCF Valuation: Automatically computes intrinsic value, NPV, and various financial metrics.
- High-Precision Accuracy: Leverages real-world data from Nextracker for reliable valuation results.
- Simplified Scenario Analysis: Easily explore different assumptions and analyze their impacts.
- Efficient Valuation Tool: Streamlines the valuation process, eliminating the need for complex model setups.
How It Works
- Step 1: Download the prebuilt Excel template featuring Nextracker Inc. (NXT) data.
- Step 2: Review the pre-filled sheets to familiarize yourself with the essential metrics.
- Step 3: Modify forecasts and assumptions in the editable yellow cells (WACC, growth, margins).
- Step 4: Instantly see the recalculated results, including Nextracker Inc.'s (NXT) intrinsic value.
- Step 5: Utilize the outputs to make informed investment decisions or create detailed reports.
Why Opt for Nextracker's Calculator?
- Accuracy: Utilizes authentic Nextracker financial data for precise calculations.
- Flexibility: Allows users to easily adjust and test various inputs.
- Time-Saving: Eliminate the need to create a DCF model from the ground up.
- Professional-Grade: Crafted with the expertise and usability expected by CFOs.
- User-Friendly: Intuitive and accessible, even for those new to financial modeling.
Who Can Benefit from Nextracker Inc. (NXT)?
- Professional Investors: Develop comprehensive and trustworthy valuation models for portfolio evaluation.
- Corporate Finance Teams: Examine valuation scenarios to inform strategic decision-making.
- Consultants and Advisors: Equip clients with precise valuation insights for Nextracker Inc. (NXT) stock.
- Students and Educators: Utilize real-world data to enhance financial modeling practice and education.
- Renewable Energy Enthusiasts: Gain insights into how companies like Nextracker Inc. (NXT) are valued in the market.
What the Template Includes
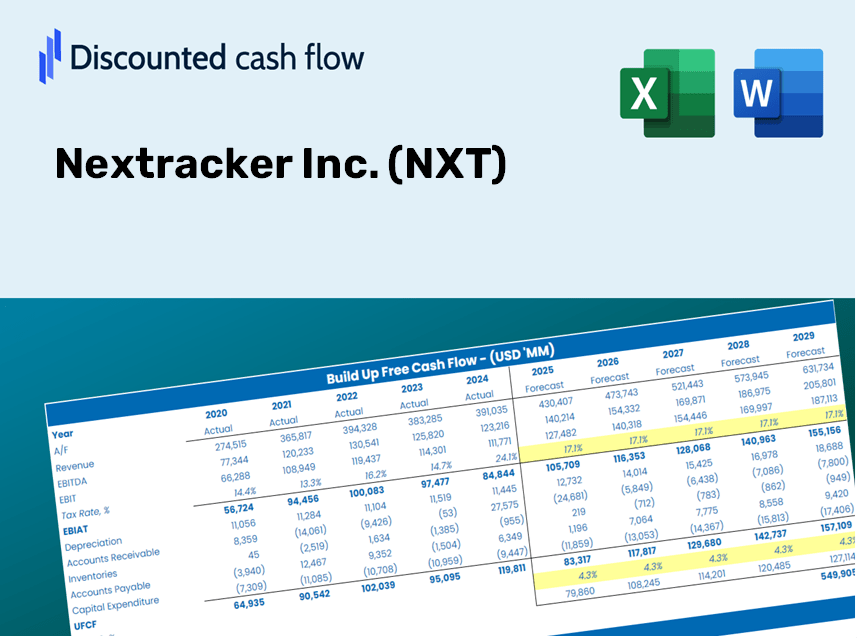
- Operating and Balance Sheet Data: Pre-filled Nextracker historical data and forecasts, featuring revenue, EBITDA, EBIT, and capital expenditures.
- WACC Calculation: A specific sheet dedicated to the Weighted Average Cost of Capital (WACC), encompassing parameters such as Beta, risk-free rate, and share price.
- DCF Valuation (Unlevered and Levered): Customizable Discounted Cash Flow models that display intrinsic value along with comprehensive calculations.
- Financial Statements: Pre-loaded financial statements (both annual and quarterly) to facilitate thorough analysis.
- Key Ratios: Features profitability, leverage, and efficiency ratios specific to Nextracker Inc. (NXT).
- Dashboard and Charts: Visual overview of valuation outputs and assumptions for easy result analysis.
Disclaimer
All information, articles, and product details provided on this website are for general informational and educational purposes only. We do not claim any ownership over, nor do we intend to infringe upon, any trademarks, copyrights, logos, brand names, or other intellectual property mentioned or depicted on this site. Such intellectual property remains the property of its respective owners, and any references here are made solely for identification or informational purposes, without implying any affiliation, endorsement, or partnership.
We make no representations or warranties, express or implied, regarding the accuracy, completeness, or suitability of any content or products presented. Nothing on this website should be construed as legal, tax, investment, financial, medical, or other professional advice. In addition, no part of this site—including articles or product references—constitutes a solicitation, recommendation, endorsement, advertisement, or offer to buy or sell any securities, franchises, or other financial instruments, particularly in jurisdictions where such activity would be unlawful.
All content is of a general nature and may not address the specific circumstances of any individual or entity. It is not a substitute for professional advice or services. Any actions you take based on the information provided here are strictly at your own risk. You accept full responsibility for any decisions or outcomes arising from your use of this website and agree to release us from any liability in connection with your use of, or reliance upon, the content or products found herein.