
|
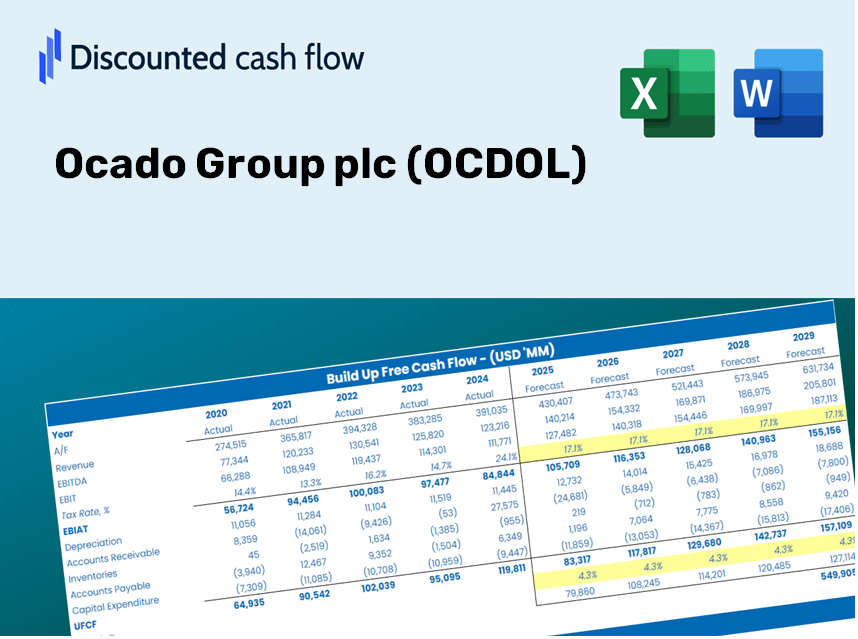
Ocado Group plc (OCDO.L) DCF Valuation |
Fully Editable: Tailor To Your Needs In Excel Or Sheets
Professional Design: Trusted, Industry-Standard Templates
Investor-Approved Valuation Models
MAC/PC Compatible, Fully Unlocked
No Expertise Is Needed; Easy To Follow
Ocado Group plc (OCDO.L) Bundle
Enhance your investment strategy with the Ocado Group plc (OCDOL) DCF Calculator! Utilize authentic Ocado financial data, adjust growth predictions and expenses, and observe how these modifications affect the intrinsic value of Ocado Group plc (OCDOL) in real-time.
What You'll Receive
- Comprehensive OCDOL Financial Data: Pre-loaded with Ocado Group plc’s historical and projected figures for accurate analysis.
- Customizable Template: Easily adjust key inputs such as revenue growth, WACC, and EBITDA %.
- Instant Calculations: Watch the intrinsic value of Ocado Group plc update in real-time as you make changes.
- Expert Valuation Tool: Tailored for investors, analysts, and consultants in pursuit of precise DCF outcomes.
- Intuitive Design: Accessible layout and straightforward instructions suitable for all skill levels.
Key Features
- Comprehensive DCF Calculator: Offers in-depth unlevered and levered DCF valuation models tailored for Ocado Group plc (OCDOL).
- WACC Calculator: Streamlined Weighted Average Cost of Capital sheet with adjustable parameters.
- Customizable Forecast Inputs: Easily change growth projections, capital investments, and discount rates.
- Integrated Financial Ratios: Assess profitability, leverage, and efficiency metrics specific to Ocado Group plc (OCDOL).
- Interactive Dashboard and Visuals: Graphical representations summarize essential valuation metrics for quick interpretation.
How It Functions
- Step 1: Download the Excel spreadsheet.
- Step 2: Examine Ocado’s pre-populated financial figures and projections.
- Step 3: Adjust key inputs such as revenue growth, WACC, and tax rates (highlighted cells).
- Step 4: Observe the DCF model refresh in real-time as you modify your assumptions.
- Step 5: Evaluate the results and apply the findings for your investment strategies.
Why Opt for Our Calculator?
- Time Efficient: Skip the hassle of building a DCF model from the ground up – it’s ready for immediate use.
- Enhanced Accuracy: Dependable financial data and formulas minimize valuation errors.
- Completely Customizable: Adjust the model to accurately represent your assumptions and forecasts.
- User-Friendly: Intuitive charts and outputs simplify the analysis of results.
- Endorsed by Professionals: Crafted for experts who prioritize both accuracy and ease of use.
Who Should Utilize This Product?
- Investors: Precisely assess the fair value of Ocado Group plc (OCDOL) before making investment choices.
- CFOs: Utilize a professional-grade DCF model for accurate financial reporting and analysis for Ocado Group plc (OCDOL).
- Consultants: Easily modify the template for creating valuation reports tailored to clients involving Ocado Group plc (OCDOL).
- Entrepreneurs: Acquire valuable insights into financial modeling practices employed by leading companies like Ocado Group plc (OCDOL).
- Educators: Employ this tool to illustrate valuation methodologies in a classroom setting, focusing on Ocado Group plc (OCDOL).
Contents of the Template
- Operating and Balance Sheet Data: Pre-filled historical data and forecasts for Ocado Group plc (OCDOL), including revenue, EBITDA, EBIT, and capital expenditures.
- WACC Calculation: A separate sheet dedicated to the Weighted Average Cost of Capital (WACC), incorporating key parameters such as Beta, risk-free rate, and share price.
- DCF Valuation (Unlevered and Levered): Customizable Discounted Cash Flow models that illustrate the intrinsic value with thorough calculations.
- Financial Statements: Pre-loaded annual and quarterly financial statements to facilitate comprehensive analysis.
- Key Ratios: Contains profitability, leverage, and efficiency ratios specific to Ocado Group plc (OCDOL).
- Dashboard and Charts: A visual overview of valuation outputs and underlying assumptions for straightforward result analysis.
Disclaimer
All information, articles, and product details provided on this website are for general informational and educational purposes only. We do not claim any ownership over, nor do we intend to infringe upon, any trademarks, copyrights, logos, brand names, or other intellectual property mentioned or depicted on this site. Such intellectual property remains the property of its respective owners, and any references here are made solely for identification or informational purposes, without implying any affiliation, endorsement, or partnership.
We make no representations or warranties, express or implied, regarding the accuracy, completeness, or suitability of any content or products presented. Nothing on this website should be construed as legal, tax, investment, financial, medical, or other professional advice. In addition, no part of this site—including articles or product references—constitutes a solicitation, recommendation, endorsement, advertisement, or offer to buy or sell any securities, franchises, or other financial instruments, particularly in jurisdictions where such activity would be unlawful.
All content is of a general nature and may not address the specific circumstances of any individual or entity. It is not a substitute for professional advice or services. Any actions you take based on the information provided here are strictly at your own risk. You accept full responsibility for any decisions or outcomes arising from your use of this website and agree to release us from any liability in connection with your use of, or reliance upon, the content or products found herein.