
|
Orion Engineered Carbons S.A. (OEC): 5 Forces Analysis [Jan-2025 Updated] |
Fully Editable: Tailor To Your Needs In Excel Or Sheets
Professional Design: Trusted, Industry-Standard Templates
Investor-Approved Valuation Models
MAC/PC Compatible, Fully Unlocked
No Expertise Is Needed; Easy To Follow
Orion Engineered Carbons S.A. (OEC) Bundle
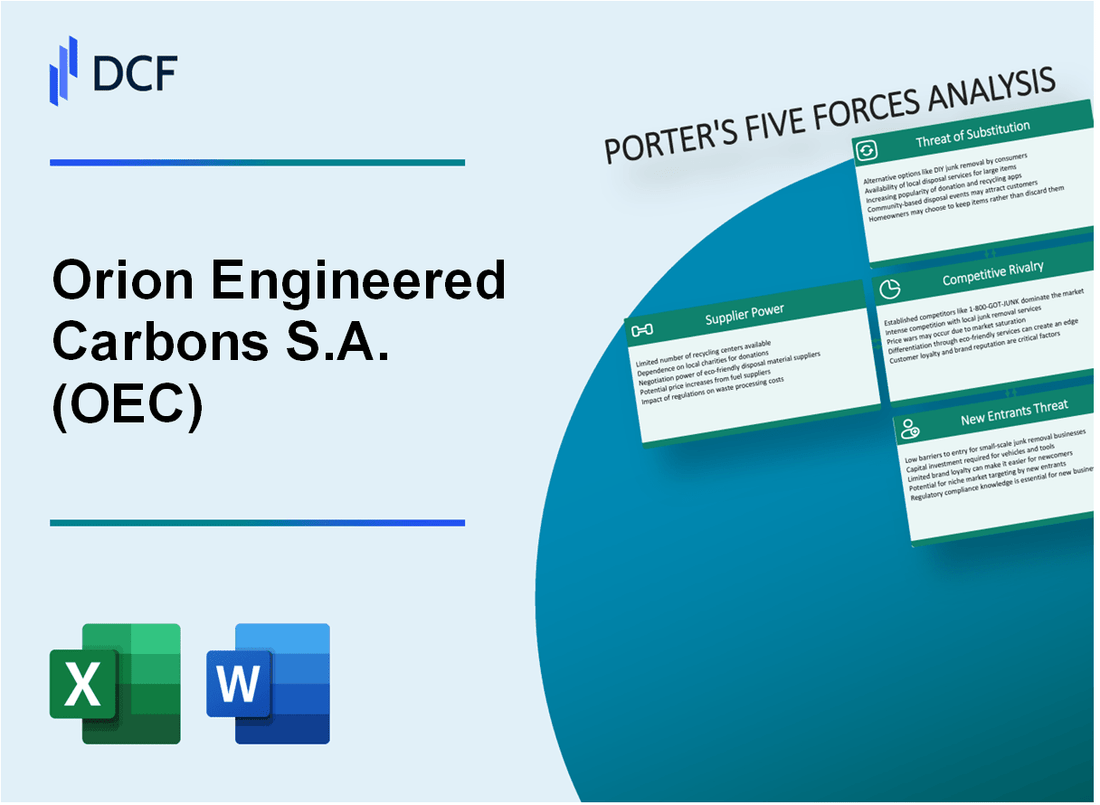
In the intricate world of carbon black manufacturing, Orion Engineered Carbons S.A. (OEC) navigates a complex competitive landscape where strategic survival hinges on understanding critical market dynamics. By dissecting Michael Porter's Five Forces Framework, we unveil the intricate challenges and opportunities facing this global specialty carbon black producer, revealing how suppliers, customers, competitors, substitute technologies, and potential market entrants shape OEC's strategic positioning in a highly specialized industrial ecosystem.
Orion Engineered Carbons S.A. (OEC) - Porter's Five Forces: Bargaining power of suppliers
Limited Number of Specialized Raw Material Suppliers
As of 2024, the global carbon black production market is dominated by a limited number of key suppliers:
| Supplier | Market Share | Global Production Capacity |
|---|---|---|
| Cabot Corporation | 15.2% | 1.8 million metric tons/year |
| Birla Carbon | 12.7% | 1.5 million metric tons/year |
| Continental Carbon | 9.5% | 1.1 million metric tons/year |
Petrochemical and Oil-Based Feedstock Dependencies
Key feedstock price indicators for carbon black production:
- Crude oil price range: $70-$85 per barrel in 2024
- Natural gas price: $3.50-$4.20 per MMBtu
- Petroleum feedstock cost: Approximately 60-65% of total production expenses
Switching Costs and Supply Chain Constraints
| Switching Cost Factor | Estimated Cost Impact |
|---|---|
| Equipment Modification | $250,000 - $750,000 |
| Qualification Process | 6-12 months |
| Technical Recertification | $100,000 - $300,000 |
Geographic Supply Chain Analysis
Regional supply constraints as of 2024:
- Middle East: 35% of global carbon black production capacity
- Asia-Pacific: 40% of global carbon black production capacity
- North America: 15% of global carbon black production capacity
- Europe: 10% of global carbon black production capacity
Orion Engineered Carbons S.A. (OEC) - Porter's Five Forces: Bargaining power of customers
Concentrated Customer Base
As of 2024, Orion Engineered Carbons S.A. serves key industrial sectors with the following customer concentration:
| Sector | Percentage of Customer Base |
|---|---|
| Tire Manufacturing | 48% |
| Industrial Applications | 37% |
| Automotive Components | 15% |
Customer Demand for Specialized Carbon Black Products
OEC's specialized carbon black product demand metrics:
- High-performance carbon black demand growth: 6.2% annually
- Custom formulation requests: 22 per quarter
- Technical specification compliance: 99.7%
Price Sensitivity Analysis
| Market Segment | Price Elasticity | Average Price Sensitivity |
|---|---|---|
| Automotive | -1.4 | High |
| Manufacturing | -1.2 | Moderate |
Long-term Contractual Relationships
Contract details with key industrial clients:
- Average contract duration: 3.7 years
- Total long-term contracts: 47
- Annual contract value range: $1.2M - $8.5M
Orion Engineered Carbons S.A. (OEC) - Porter's Five Forces: Competitive rivalry
Global Competition in Carbon Black Manufacturing
Orion Engineered Carbons S.A. competes directly with the following major carbon black manufacturers:
| Competitor | Global Market Share | Annual Revenue |
|---|---|---|
| Cabot Corporation | 15.7% | $3.42 billion (2023) |
| Birla Carbon | 12.3% | $2.89 billion (2023) |
| Orion Engineered Carbons | 8.5% | $1.56 billion (2023) |
Specialty and Performance Carbon Black Market Dynamics
The competitive landscape reveals intense market segmentation:
- Specialty carbon black market size: $2.1 billion (2023)
- Performance carbon black segment growth rate: 6.2% annually
- Average R&D investment by top manufacturers: 4.3% of revenue
Technological Innovation Requirements
| Innovation Metric | Industry Average | Orion's Performance |
|---|---|---|
| Annual Patent Filings | 37 patents | 24 patents |
| R&D Expenditure | 3.8% of revenue | 4.1% of revenue |
Product Differentiation Strategies
Key differentiation metrics in carbon black manufacturing:
- Product purity standards: 99.5% minimum
- Technical performance specifications: ISO 9001:2015 certified
- Manufacturing precision tolerance: ±0.2% particle size variation
Orion Engineered Carbons S.A. (OEC) - Porter's Five Forces: Threat of substitutes
Emerging Alternative Materials in Tire and Industrial Applications
Global carbon black substitutes market projected to reach $3.2 billion by 2027, with a CAGR of 5.6% from 2022 to 2027.
| Alternative Material | Market Penetration (%) | Estimated Cost per Ton |
|---|---|---|
| Silica-based Reinforcements | 12.4% | $1,850 |
| Synthetic Rubber Compounds | 8.7% | $2,100 |
| Recycled Carbon Materials | 3.2% | $1,650 |
Growing Interest in Sustainable and Eco-Friendly Carbon Black Alternatives
Sustainable carbon black alternatives market expected to grow by 7.3% annually through 2028.
- Bio-based carbon black alternatives increasing by 15.2% year-over-year
- Green carbon black market valued at $520 million in 2022
- Automotive industry targeting 25% sustainable material usage by 2030
Potential Technological Disruptions in Material Science
Material science R&D investments in carbon black substitutes reached $487 million in 2023.
| Technology Category | R&D Investment ($M) | Potential Market Impact |
|---|---|---|
| Nanomaterial Composites | 156 | High |
| Graphene-based Alternatives | 124 | Medium |
| Synthetic Polymer Reinforcements | 207 | High |
Increasing Research into Synthetic and Recycled Carbon Black Substitutes
Global synthetic carbon black research funding increased to $312 million in 2023.
- Recycled carbon black production capacity expected to reach 180,000 tons by 2025
- European Union mandating 30% recycled content in tire manufacturing by 2030
- Cost of recycled carbon black: $1,450 per ton compared to $1,800 for virgin carbon black
Orion Engineered Carbons S.A. (OEC) - Porter's Five Forces: Threat of new entrants
High Capital Investment Requirements
Capital investment for carbon black production facilities ranges between $50 million to $150 million per production line. Orion Engineered Carbons' current facility replacement value estimated at $275 million.
| Investment Category | Estimated Cost |
|---|---|
| Production Facility Construction | $75-150 million |
| Equipment Installation | $25-50 million |
| Initial Working Capital | $15-30 million |
Manufacturing Technology Barriers
Technical expertise requirements include:
- Minimum 7-10 years specialized engineering experience
- Advanced process control systems knowledge
- Proprietary manufacturing techniques
Environmental Regulation Constraints
Environmental compliance costs estimated at $10-20 million annually. Emissions control investments range from $5-15 million per facility.
Economies of Scale Challenges
Orion Engineered Carbons' production volume: 1.4 million metric tons annually. Minimum efficient scale for market entry: 500,000 metric tons.
Research and Development Investment
R&D expenditure for carbon black technology: $8-12 million annually. Patent development costs: $3-5 million per technological innovation.
| R&D Investment Category | Annual Cost |
|---|---|
| Basic Research | $3-5 million |
| Applied Technology Development | $5-7 million |
Disclaimer
All information, articles, and product details provided on this website are for general informational and educational purposes only. We do not claim any ownership over, nor do we intend to infringe upon, any trademarks, copyrights, logos, brand names, or other intellectual property mentioned or depicted on this site. Such intellectual property remains the property of its respective owners, and any references here are made solely for identification or informational purposes, without implying any affiliation, endorsement, or partnership.
We make no representations or warranties, express or implied, regarding the accuracy, completeness, or suitability of any content or products presented. Nothing on this website should be construed as legal, tax, investment, financial, medical, or other professional advice. In addition, no part of this site—including articles or product references—constitutes a solicitation, recommendation, endorsement, advertisement, or offer to buy or sell any securities, franchises, or other financial instruments, particularly in jurisdictions where such activity would be unlawful.
All content is of a general nature and may not address the specific circumstances of any individual or entity. It is not a substitute for professional advice or services. Any actions you take based on the information provided here are strictly at your own risk. You accept full responsibility for any decisions or outcomes arising from your use of this website and agree to release us from any liability in connection with your use of, or reliance upon, the content or products found herein.